


引言
目前,对MCI的辅助诊断通常采用静息态功能磁共振成像(Rest-state Functional Magnetic Resonance Imaging,rs-fMRI)技术提取被试的功能连接(Functional Connectivity,FC)来度量不同脑区间的功能协同关系,并结合FC和图论来对MCI与正常认知(Normal Cognition,NC)之间的差异进行研究[3,4].在基于rs-fMRI的FC研究中,通常假设不同脑区间的FC在rs-fMRI整个采集期间是恒定的,称为静态功能连接(Static Functional Connectivity,sFC)[5].然而最近越来越多的研究表明,在不同的生理大脑条件下,即使是处于静息状态,大脑的FC也是动态的[6].动态功能连接(Dynamic Functional Connectivity,dFC)分析逐渐成为一种主流的分析方法.相比sFC,dFC包含更丰富、复杂的动态协同信息[7,8].构建dFC的常用方法主要包括滑动窗相关法(Sliding Window Correlation,SWC)、小波变换法和共激活模式[9⇓⇓-12].由于SWC简单易行,大多数的dFC分析方法都是基于SWC做的改进.已有研究将对脑信号只进行一次相关计算得到的FC网络定义为低阶FC网络,进行两次及以上相关计算得到的FC网络定义为高阶FC网络,而sFC和dFC因为都只进行了一次相关计算且只考虑了脑区间功能上的相互作用被认为是低阶网络[13],高阶FC网络相比传统的低阶FC网络能够揭示更高层次和更复杂的交互关系,是更加有效的分析方法.Chen等[13]提出了一种高阶FC网络的构建方法,首先通过SWC方法在每个窗口内构建低阶FC网络,然后根据其内在的共同模式分成少量不同的聚类.通过计算各类的平均时间序列之间的相关性,以表征不同脑区域对之间的高阶相关性.Zhang等[14]在高阶FC网络的基础上提出了混合高阶FC网络的构建方法,基于SWC分别构建低阶FC网络和高阶FC网络,将构建在不同层次上的多个时变FC网络经过多核学习完成互补特征的融合.这些基于高阶FC网络的研究提供了更多可用于提高诊断性能的先验知识.图论因具有表征复杂脑网络的突出能力,在神经影像领域中的应用十分广泛[15].Salvador等[16]构建了静息态下健康被试的大脑功能网络,首先通过先验脑图谱提取被试大脑90个脑区的平均时间序列,然后计算被试不同脑区间平均时间序列的偏相关矩阵,最后经过阈值化构建无向图,从而获得功能性脑网络模型.Stam等[17]采用脑电图、脑磁图及fMRI等成像技术建立了“小世界”网络模型,并应用于研究功能性脑网络拓扑性质与阿尔茨海默病之间的关系,利用基于图论的脑网络分析方法对以上问题进行了探讨.结果发现阿尔茨海默病患者脑功能网络的最短路径长度相对于正常人显著增加,神经网络组织效率明显下降.经过这些年的发展,rs-fMRI技术和图论方法的结合在脑疾病辅助诊断方面取得了较好的成果.然而,现有图论研究的重心主要集中在低阶FC网络中.高阶FC网络能够揭示大脑更高层次和更复杂的交互关系,但由于图谱映射中面临高维度数据的复杂性,在高阶FC网络开展图论研究较为困难,目前涉及的相关研究较少,亟待更深一步的探索.Wang等[18]提出了一种基于高阶动态功能连接的图论网络构建方法,对比了低阶FC网络与高阶FC网络在传统图论指标中的差异性与分类性能,结果证实了高阶FC网络能呈现更显著的差异性及更好的分类准确率.
针对以上问题,本文的主要贡献如下:
(1)定义阻滞系数和平均转换时间两个新的图论指标,以表征高阶FC网络的时间变异性.基于SWC和高阶相关提取高阶动态功能连接信息(High-order Dynamic Functional Connection,HodFC)并基于此构建高阶FC网络,应用图论提取传统图论指标和新定义的图论指标,通过高阶FC网络的时间变异性辅助诊断轻度认知障碍疾病.
(2)将全脑网络划分为6个子网络,对每个子网络分别构建高阶FC网络并提取图论指标,对比子网络之间的特征差异,更深一步的探索全脑网络和子网络的图论特性.
1 数据与方法
1.1 数据来源与预处理
表1 人口统计学特征
Table 1
| 特征 | 组别(均值±标准差) | p值 | |
|---|---|---|---|
| MCI(40) | NC(40) | ||
| 年龄 | 75.17±7.58 | 76.50±7.04 | 0.259 |
| 性别(男性/女性) | 21/19 | 17/23 | 0.377 |
| 受教育年限 | 13.37±4.37 | 12.57±3.39 | 0.365 |
| MMSE评分 | 23.68±1.89 | 29.48±0.78 | 0.001 |
| CDR评分 | ≥1 | 0 | - |
注:MMSE为简明精神状态检查量表(Mini Mental State Examination);CDR为临床痴呆评定量表(Clinical Dementia Rating).
表2 rs-fMRI数据详细参数
Table 2
| 参数 | 描述 |
|---|---|
| 数据库 | ADNI-2 |
| 磁场强度 | 3.0 T |
| 采集设备 | Philips |
| 翻转角 | 80° |
| TR | 3000 ms |
| TE | 30 ms |
| 像素间距 | 3.3 mm×3.3 mm |
| 切片数量 | 48 |
| 时间点 | 140 |
本实验使用数据处理和脑成像分析(Data Processing & Analysis of Brain Imaging,DPABI)工具箱[20]进行数据预处理,下载地址为:
(1)由于稳定设备磁场以及被试者适应环境需要一段时间,前几个时间点图像噪声较多,因此去除前10帧图像;
(2)以第48个切片为基准进行时间层校正;
(3)进行被试头动矫正,将头动位移超过3 mm及旋转角度超过3˚的被试排除;
(4)将结构图像通过线性变换与功能图像进行配准,变换后的结构图像被分割为灰质、白质和脑脊液,功能图像归一化到蒙特利尔神经病学研究所空间;
(5)进行归一化和平滑,保留频率范围为0.01~0.1 Hz的信号,以此滤除低频偏移和高频噪声;
(6)全局平均信号、六个头部运动参数、脑脊液和白质信号也作为有害协变量被清除;
(7)选配准质量好的结构像与功能像,剔除预处理不合格的被试,最后每个被试得到116个感兴趣区(Region of interest,ROI)的平均时间序列.
1.2 传统图论指标
表3 选取的传统图论指标
Table 3
| 指标 | 意义 |
|---|---|
| 平均路径长度 | 每对节点之间的最短距离的均值 |
| 最大度数 | 入射到顶点的最大边数 |
| 图密度 | 边数与所有可能边数的比值 |
| 聚类系数 | 图中节点聚集程度的系数,代表节点间的交互关系程度 |
| 边连通性 | 获得非强连接图所需的最小边数 |
| 小世界属性 | 定量表达为 |
1.3 脑功能子网络划分
已有研究观认为大脑分布区域的时间同步活动是大脑功能的重要特征[22].Liu等[23]发现认知障碍患者的静息态网络中因果相互作用发生了变化,默认模式网络的相互作用减弱,记忆网络与执行控制网络中的因果连接性增强.Fatemeh等[24]研究表明注意网络的断线严重程度随着疾病的进展而增加,且感觉运动网络的运动前皮层激活减少.因此,记忆网络和执行网络相关的子网络更适合评估早期MCI患者相关变化.为更深一步探索脑功能网络的特性,本文采用文献[25]中的子网络划分标准,将自动解剖标记图谱 (Anatomical Automatic Labeling,AAL)模板除去小脑的90个脑区划分为6个参与记忆和执行功能的静息态子网络,分别是默认网络(Default Mode Network,DMN)、注意网络(Attention Network,ATT)、皮质下网络(Subcortical Network,SUB)、视觉网络(Visual Network,VIS)、听觉网络(Auditory Network,AUD)和感觉运动网络(Sensorimotor Network,SEN),如表4所示.在本文的研究中,将在全脑和各子网络中开展高阶FC网络的研究,以便更全面的分析MCI疾病在全脑和各子网络中的差异性.
表4 脑功能子网络划分
Table 4
| 子网名称 | 英文简称 | 脑区数量 | 包含脑区名称 |
|---|---|---|---|
| 默认网络 | DMN | 20 | 背外侧额上回、内侧额上回、眶内额上回、回直肌、前扣带和旁扣带脑回、后扣带回、角回、楔前叶、颞中回、颞极:颞中回 |
| 注意网络 | ATT | 16 | 眶部额上回、额中回、眶部额中回、岛盖部额下回、三角部额下回、眶部额下回、顶上回、顶下缘角回 |
| 皮质下网络 | SUB | 20 | 嗅皮质、内侧和旁扣带脑回、海马、海马旁回、杏仁核、尾状核、豆状壳核、豆状苍白球、丘脑、颞下回 |
| 视觉网络 | VIS | 14 | 距状裂周围皮层、楔叶、舌回、枕上回、枕中回、枕下回、梭状回 |
| 听觉网络 | AUD | 12 | 中央沟盖、脑岛、缘上回、颞横回、颞上回、颞极:颞上回 |
| 感觉运动网络 | SEN | 8 | 中央前回、补充运动区、中央后回、中央旁小叶 |
1.4 高阶FC网络的构建
图1
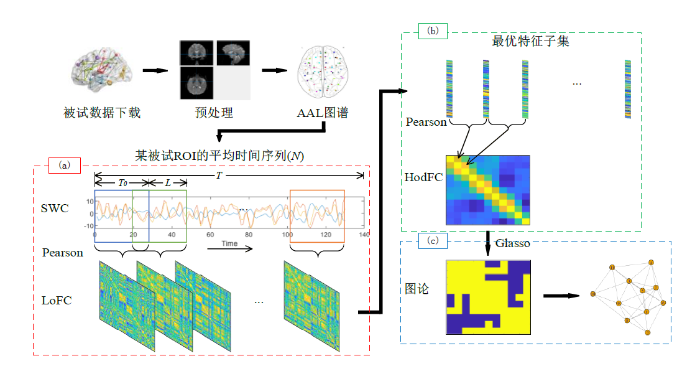
(1)提取LoFC信息:对rs-fMRI数据预处理后,使用AAL模板得到N个ROI的平均时间序列,每个ROI的平均时间序列长度均为T.令
其中
(2)选取最优特征子集:HodFC在
其中
选取的最优特征子集为:
(3)提取HodFC信息:对每对窗口内的
其中
(8)式中
(4)网络构建:采用图论进行分析需要将HodFC信息映射到二维图中.本文采用Glasso来估计HodFC稀疏无向图模型[26],从而得到邻接矩阵
图2
1.5 脑网络时变图论指标
1.5.1 阻滞系数指标
已有研究表明,MCI患者由于某些脑区功能缺失或脑结构病变,会导致其FC的动态变化出现滞后现象[22],当大脑任务切换时,因FC滞后会在现实中表现为短暂性遗忘或者反应迟钝等.本文将这种现象定义为功能连接阻滞(Functional Connectivity Retardation,FCR).由于高阶FC网络反映的是各脑区FC在不同时间窗口间的动态变化,因此在高阶FC网络中应该能提取到有关FCR的信息,具体表现为较长连续时间段内LoFC都保持高度相关现象,即在这一时间段内各相邻窗口间的LoFC都具有较高的相关系数.
在构建的高阶FC网络模型中,每个节点反映了对应时间窗口内的LoFC信息,而节点之间的边连接代表两个对应时间窗口间LoFC具有较高的相关性.如果在某个时间段内发生了功能连接阻滞,则该时间段内涉及的若干相邻节点之间都会存在边连接关系,一方面导致这些节点的度数增大,另一方面,邻接节点的连接关系会更稳固,使得节点间边的权重也会增大.Sen等[28]提出了节点熵的概念,定义为对节点邻接加权边归一化的香农熵,如(9)式所示:
其中,I为度数,
式中
1.5.2 平均转换时间指标
由于高阶FC网络模型中的每个节点代表一个窗口内的LoFC信息,因此可以将一个节点视为脑功能网络的一个瞬时工作状态.节点间的边表示两窗口内的LoFC高度相关,节点间存在边的连接则可以认为两节点的脑功能网络瞬时工作状态相似,节点间若存在较多的边连接表示脑功能网络在较多时间窗口的瞬时工作状态均相似,意味着LoFC更稳定,反之,则意味着LoFC更活跃.基于以上分析,为了评估脑功能网络在时间上的稳定性及活跃程度,定义从当前节点开始持续至首次不与该节点邻接的时间为当前节点的转换时间.转换时间表征了大脑首次完全切出当前工作状态所需的时间,转换时间越短,脑功能网络越活跃,反之则越稳定.由于需要衡量整个数据采集时间内的活跃水平,进一步定义平均转换时间,它为所有节点转换时间的平均值.
为了说明转换时间的定义,给出一个N=7、T=T0的网络模型实例,如图3所示.图中圆圈及其中的数字表示高阶FC网络模型中的节点,节点编号越大代表其所处时间窗口越靠后,假设任意两节点间的时间间隔为T0,节点间的实线表示两节点间存在连接关系,虚线框表示从节点1开始到节点4时发生第一次状态转换.
图3
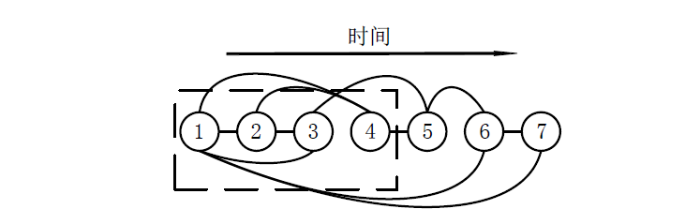
图3中,节点1与节点2、3、4、6、7间存在连接关系,将节点1视作当前节点,由于节点1与节点2、3、4存在边连接,而到节点5时首次不存在边连接,即到节点5时脑网络切出节点1的瞬时工作状态,此时节点1的转换时间为从节点1到节点4所需时间即3T0.虽然节点6与节点1存在边连接,但节点6之后计算的为第二次转换时间,在这里只考虑首次转换时间.计算转换时间的伪代码如下:
1.6 分类性能测试
针对每个被试,在全脑及各功能子网络上分别构建高阶脑网络并提取网络的多种图论指标,以此作为分类器的输入进行分类测试,并将分类结果与传统FC分析方法所得分类结果进行对比.在FC的分析传统方法中,通常假设不同大脑区域间的FC在rs-fMRI的整个记录期间是恒定的,因此将各ROI时间序列间的皮尔逊相关系数作为FC,直接使用被试的FC输入分类器进行分类,在此过程中,只进行一次相关计算且不包含时间维度.
由于rs-fMRI的相关研究通常基于少量的研究对象,且实验数据通常呈现非线性,支持向量机(Support Vector Machines,SVM)在处理小样本、非线性等数据具有优势,因此本文使用SVM分类器对MCI组和NC组提取的图论特征进行分类.为了克服由于训练和测试样本少而导致的泛化损失,SVM分类采用5折交叉验证的策略,将总数据集共80个被试随机划分为5等份,其中4份为训练集,包含64个被试,1份为测试集,包含16个被试,5份中的每一份都会做一次测试集,共进行5次分类实验,交叉验证的分类准确率为5次分类准确率的均值.为了避免偶然性,重复交叉验证实验100次,最后的分类准确率取100次实验的平均值.本文采用4个指标评价分类方法的性能,即准确率(Accuracy,ACC)、敏感性(Sensitivity,SEN)、特异性(Specificity,SPE)和受试者工作特征曲线下面积(Area Under the Curve,AUC),定义分别如下:
ACC指正确识别的被试总数占所有被试的比例.它表征了正确预测的百分比,计算为公式为
其中TP为真正例,TN为真反例,FP为假正例,FN为假反例.
SEN指正确识别的疾病被试数占所有实际疾病被试总数的比例.它衡量的是识别疾病存在的能力,计算公式为
SPE指正确识别的非疾病被试数占所有实际非疾病被试总数的比例.它衡量的是避免错误地将健康个体识别为疾病个体的能力,计算公式为
AUC指受试者工作特征曲线下的面积,提供了一个单一的数字来衡量测试方法的整体性能.AUC值的范围是0到1,其中1表示完美的测试性能,0.5表示没有区分能力,大于0.5但小于1表示具有一定的区分能力.
2 结果与讨论
2.1 高阶FC网络中的FCR现象
提取被试的HodFC信息以对FCR现象进行观察和分析.图4为MCI组和NC组被试提取的HodFC,图中横轴和纵轴均表示节点,黄色区域表示两节点的LoFC高度相关,蓝色区域则表示不相关,密集的黄色区域表示在较多连续邻接节点间的LoFC均保持高度相关.从图4中可以看出,在第30~50及第60~90节点之间,MCI组黄色部分明显大于NC组,表示MCI组更多的邻接节点间存在LoFC高度相关现象,即MCI组表现出较长连续时间段内LoFC高度相关,此时可认为出现FCR现象.而NC组中LoFC高度相关的邻接节点更少,LoFC高度相关的持续时间段短于MCI组.综上所述,在高阶FC网络中确实可以观察到FCR现象,且MCI患者存在更严重的FCR现象.
图4
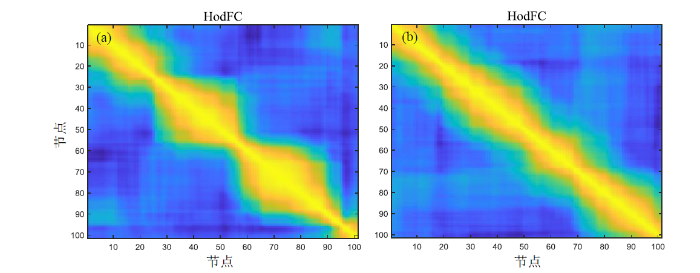
图4
HodFC中的FCR现象. (a) MCI组;(b) NC组
Fig. 4
FCR phenomenon in HodFC. (a) MCI group; (b) NC group
2.2 转换时间组平均结果
在L=30,T0=1条件下,可以获得101个节点,提取MCI组和NC组所有被试中每个节点的转换时间,再分别对MCI组和NC组所有被试的节点转换时间取平均,得到如图5所示的节点转换时间组平均,图中横坐标为节点的序号,纵坐标表示在MCI组或NC组在该节点处转换时间的组平均.需要注意,转换时间组平均结果是为了观察组间转换时间的变化差异,其并不是平均转换时间指标,被试的平均转换时间指标为该被试所有节点转换时间的平均值.
图5
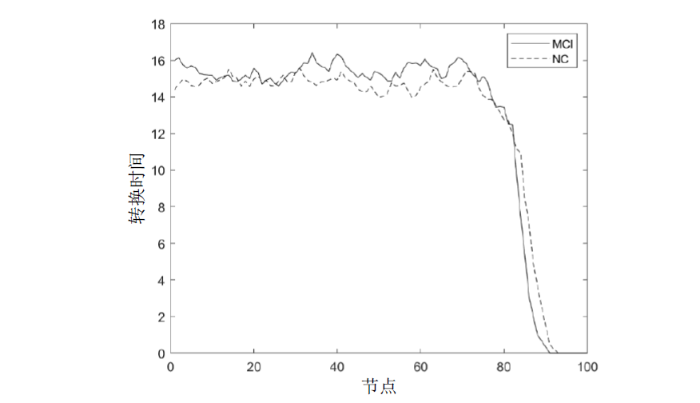
从图5中可以看出,MCI组的转换时间曲线整体高于NC组,即MCI组的脑功能网络转换所需的时间更长.图中在第80个节点之后转换时间骤减,是由于越靠后的节点,用以计算其转换时间的节点越少,可能出现直到设备采集时间结束状态仍未转换,此时该节点转换时间计算为0.在后续实验中计算每个被试的平均转换时间时,将剔除这些未经过状态转换的节点,以保证实验结果的合理性.此外,MCI组转换时间衰减速度快于NC组,因为其转换时间长,会比NC组更早的观察不到状态转换.实验结果表明,MCI患者存在更严重的FCR现象,导致其在较长时间的瞬时工作状态均相似,状态转换受阻致使其转换所需时间更长.
2.3 全脑高阶网络分析
为了验证本文在高阶FC网络中提出的阻滞系数、平均转换时间及其他常用图论指标在MCI组与NC组的差异性方面的贡献,提取被试的HodFC信息,对其构建高阶FC网络并提取各项图论指标进行分析,表6为全脑高阶FC网络各图论指标双样本t检验的结果.
表6 全脑高阶网络各图论指标t检验
Table 6
| 指标 | 组别(均值±标准差) | p值 | |
|---|---|---|---|
| MCI | NC | ||
| 阻滞系数 | 1.24±0.35 | 0.95±0.30 | 0.001** |
| 平均转换时间 | 15.24±1.06 | 14.61±1.14 | 0.013* |
| 平均路径长度 | 1.86±0.17 | 2.13±0.40 | 0.008** |
| 最大度数 | 51.23±7.84 | 44.83±7.63 | 0.001** |
| 图密度 | 0.34±0.05 | 0.30±0.04 | <0.001** |
| 聚类系数 | 0.67±0.03 | 0.70±0.04 | 0.002** |
| 边连通性 | 18.88±4.05 | 14.82±4.25 | 0.001** |
| 小世界属性 | 2.49±0.22 | 2.59±0.18 | 0.027* |
*表示p<0.05,**表示p<0.01.
从表中可以得到如下结论:
(1)在MCI患者和NC被试的全脑高阶网络中,本文提出的阻滞系数和平均转换时间两个指标均呈现出显著性差异,其中阻滞系数指标呈现0.01水平显著性差异性,平均转换时间指标呈现0.05水平显著性差异.MCI组的阻滞系数和平均转换时间的均值大于NC组,说明在全脑高阶网络中MCI组的阻滞水平高于NC组,同时脑功能网络活跃程度低于NC组.
(2)与NC组比较,MCI组的传统图论指标中的平均路径长度变短、最大度数增加、图密度升高、聚类系数降低、边连通性升高,这些指标呈现0.01水平显著性差异,小世界属性降低且呈现出0.05水平显著性差异.
综上,在MCI患者和NC被试的全脑高阶网络中,本文提出的阻滞系数、平均转换时间指标和传统图论指标均呈现出显著性差异,然而传统图论指标只能表达诸如连通性及密集程度等网络的基础属性,应用于脑网络研究中并不具备明确的生物学解释,本文提出的阻滞系数和平均转换时间指标从脑网络的时变角度进行了具体分析,具有明确的生物学意义.值得注意的是,小世界属性在所有指标的显著性水平中最低.在许多传统脑网络图论分析的研究中认为小世界属性表征大脑的拓扑结构的最佳属性[31,32],然而本文发现,高阶FC脑网络中的小世界属性并不支持这一结论.这可能是因为常规图论多用于低阶网络,在表达脑结构及FC的低阶网络中,小世界属性的改变能够较好的区分MCI组与NC组,但高阶网络重点关注FC在时间上的动态性及变异性,降低了脑结构及低阶网络的权重.实验结果表明,在高阶FC脑网络中,本文提出的阻滞系数和平均转换时间指标能够呈现MCI组和NC组的显著性差异,小世界属性的适用性有所降低.
2.4 脑功能子网络分析
对于DMN、ATT、SUB、VIS、AUD、SEN六个子网络,本文分别构建了它们的高阶FC网络,并提取了阻滞系数、平均转换时间及其他传统图论指标进行分析,表7为各个子网络在不同指标双样本t检验的结果.
表7 脑功能子网络各图论指标t检验
Table 7
| 组别 | 指标 | ||||||||
|---|---|---|---|---|---|---|---|---|---|
| 阻滞系数 | 平均转换时间 | 平均路径长度 | 最大度数 | 图密度 | 聚类系数 | 边连通性 | 小世界属性 | ||
| DMN | MCI | 1.20±0.41 | 14.73±1.41 | 2.01±0.32 | 48.20±8.49 | 0.32±0.05 | 0.69±0.04 | 16.90±4.04 | 2.58±0.23 |
| NC | 0.97±0.28 | 14.26±1.08 | 2.19±0.39 | 42.92±7.31 | 0.29±0.04 | 0.71±0.04 | 13.85±3.43 | 2.66±0.22 | |
| p值 | 0.004** | 0.097 | 0.025* | 0.004** | 0.011* | 0.055 | 0.006** | 0.081 | |
| ATT | MCI | 1.15±0.39 | 15.20±1.63 | 1.99±0.34 | 50.60±10.84 | 0.34±0.07 | 0.70±0.04 | 17.38±4.75 | 2.51±0.28 |
| NC | 0.93±0.27 | 13.85±1.13 | 2.31±0.44 | 42.30±8.27 | 0.28±0.04 | 0.72±0.04 | 13.60±3.55 | 2.65±0.21 | |
| p值 | 0.004** | 0.004** | 0.001** | <0.001** | 0.002** | 0.064 | <0.001** | 0.014* | |
| SUB | MCI | 1.12±0.35 | 14.34±1.29 | 2.11±0.36 | 45.25±8.30 | 0.30±0.05 | 0.70±0.04 | 15.68±4.40 | 2.65±0.23 |
| NC | 0.93±0.28 | 13.85±1.15 | 2.37±0.45 | 41.13±7.89 | 0.28±0.04 | 0.73±0.04 | 13.13±3.81 | 2.66±0.23 | |
| p值 | 0.009** | 0.072 | 0.005** | 0.026* | 0.036* | 0.005** | 0.007** | 0.789 | |
| VIS | MCI | 1.25±0.34 | 15.71±1.42 | 1.81±0.21 | 55.27±9.85 | 0.37±0.06 | 0.68±0.03 | 19.40±3.85 | 2.38±0.24 |
| NC | 1.01±0.39 | 14.55±1.33 | 2.07±0.41 | 47.40±9.47 | 0.32±0.05 | 0.70±0.04 | 14.53±4.58 | 2.56±0.19 | |
| p值 | 0.005** | <0.001** | 0.003** | <0.001** | <0.001** | 0.046* | <0.001** | 0.026* | |
| AUD | MCI | 1.12±0.33 | 14.25±1.41 | 2.06±0.31 | 46.85±9.94 | 0.31±0.05 | 0.69±0.04 | 15.53±4.53 | 2.64±0.27 |
| NC | 0.96±0.33 | 14.00±1.32 | 2.33±0.53 | 42.95±8.67 | 0.29±0.05 | 0.71±0.04 | 13.85±4.06 | 2.60±0.23 | |
| p值 | 0.038* | 0.418 | 0.008** | 0.065 | 0.122 | 0.036* | 0.086 | 0.535 | |
| SEN | MCI | 1.21±0.41 | 15.13±1.59 | 1.87±0.24 | 52.55±11.16 | 0.35±0.06 | 0.68±0.03 | 18.05±4.03 | 2.48±0.29 |
| NC | 0.94±0.35 | 14.17±1.40 | 2.15±0.36 | 45.80±8.76 | 0.30±0.04 | 0.71±0.04 | 14.22±4.40 | 2.63±0.21 | |
| p值 | 0.003** | 0.005** | <0.001** | 0.004** | <0.001** | 0.001** | <0.001** | 0.031* | |
*表示p<0.05,**表示p<0.01.
从表中可以得到如下结论:
(1)DMN网络中阻滞系数、最大度数、边连通性共3个指标呈现0.01水平显著性差异,平均路径长度、图密度2个指标呈现0.05水平显著性差异,平均转换时间、聚类系数、小世界属性共3个指标未呈现显著性差异;
(2)ATT网络中阻滞系数、平均转换时间、平均路径长度、最大度数、图密度、边连通性共6个指标呈现0.01水平显著性差异,小世界属性指标呈现0.05水平显著性差异,聚类系数指标未呈现显著性差异;
(3)SUB网络中阻滞系数、平均路径长度、聚类系数、边连通性共4个指标呈现0.01水平显著性差异,最大度数、图密度2个指标呈现0.05水平显著性差异,平均转换时间、小世界属性2个指标未呈现显著性差异;
(4)VIS网络中所有指标均呈现出显著性差异,其中聚类系数、小世界属性2个指标呈现出0.05水平显著性差异,其余6个指标呈现0.01水平显著性差异;
(5)AUD网络中仅有3个指标呈现显著性差异,平均路径长度指标呈现0.01水平显著性差异,阻滞系数、聚类系数2个指标呈现0.05水平显著性差异;
(6)SEN网络中仅小世界属性呈现0.05水平显著性差异,其余7个指标均呈现0.01水平显著性差异.
为了更直观的分析不同子网络的差异性结果,表8统计了子网络呈现不同差异性的指标数量.综合所有子网络的实验结果可以发现,SEN子网络呈现出0.01水平显著性的指标数量最多,在所有指标中具有最高的敏感性和区分度,表明MCI患者可能与感觉运动功能的早期受损有关.
表8 子网络呈现不同差异性的指标数量
Table 8
| 子网络 | 指标数量 | ||
|---|---|---|---|
| p>0.05 | p<0.05* | p<0.01** | |
| DMN | 3 | 2 | 3 |
| ATT | 1 | 1 | 6 |
| SUB | 2 | 2 | 4 |
| VIS | 0 | 2 | 6 |
| AUD | 5 | 2 | 1 |
| SEN | 0 | 1 | 7 |
*表示0.05水平显著性差异,**表示0.01水平显著性差异.
为了更好的分析指标在全脑及子网络间的差异,图6横向对比了各图论指标在全脑(WB)和各子网络中的结果.图中结果显示:
图6
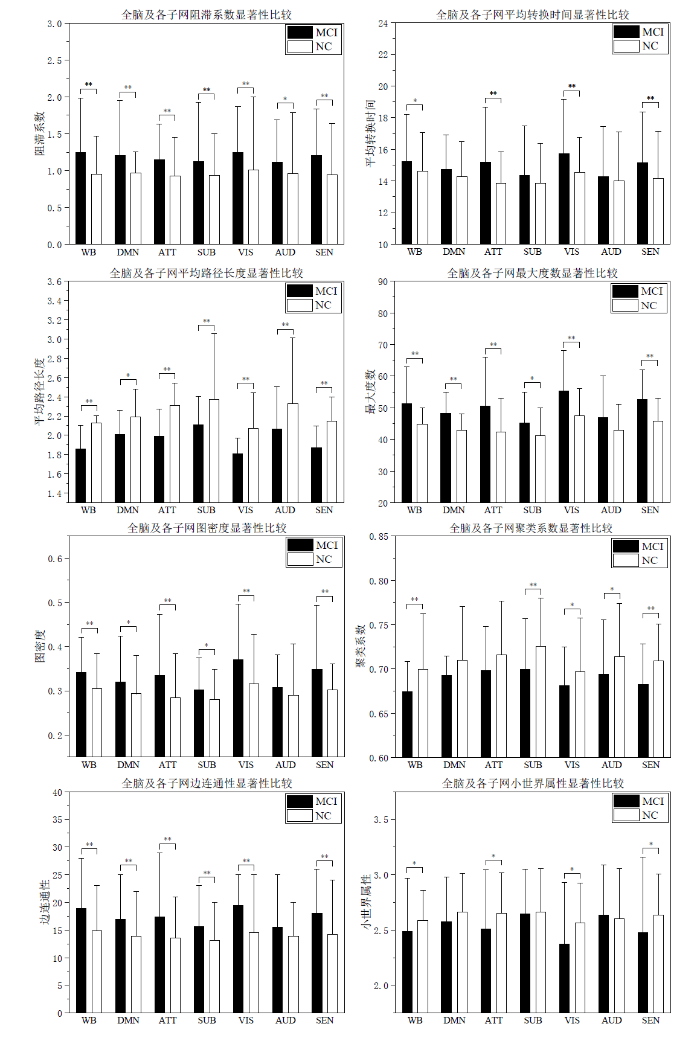
图6
各图论指标在全脑和子网络中的结果. *表示p<0.05,**表示p<0.01
Fig. 6
Results of various graph theory indicators in the whole brain and subnetworks. * represents p<0.05 and ** represents p<0.01
(1)仅有阻滞系数及平均路径长度两个指标在全脑及所有子网中均呈现显著性差异,其中阻滞系数指标在AUD子网中呈现0.05水平显著性差异,在其余子网及全脑中呈现0.01水平显著性差异,能够显著地表征组间差异性信息.在全脑及子网络的高阶网络中,MCI组的阻滞系数均大于NC组,说明MCI患者表现出更严重的FCR现象,且该FCR普遍的发生在大脑所有结构中;
(2)平均转换时间在全脑及ATT、VIS、SEN三个子网中呈现出差异性,可以认为MCI患者功能网络活跃性降低主要出现在ATT、VIS、SEN三个子网中,在DMN、SUB、AUD三个子网中虽然也有一定程度的下降但与NC组的差异并不明显;小世界属性的组间差异与平均转换时间一样体现在全脑及ATT、VIS、SEN三个子网中,其可能与功能网络的活跃性有内在的联系;
(3)平均路径长度在全脑及所有子网中均呈现显著性差异,其在DMN子网中呈现0.05水平显著性差异,在其余子网及全脑中呈现0.01水平显著性差异,且NC组均大于MCI组.在网络中越小的平均路径长度表示节点间的分离程度越低,节点间信息传递所需的中间步骤越少,网络具有越高的局部连接性.这一特征与阻滞系数所表示的LoFC在较长连续时间段内都保持高度相关现象存在对应关系,即较小的平均路径长度对应较大的阻滞系数;
(4)最大度数、图密度及边连通性三个指标在DMN、ATT、SUB、VIS、SEN五个子网络中均呈现出显著性差异,且MCI组指标均大于NC组,但在AUD子网络中未能体现出差异性.AUD主要负责处理听觉信息,推测其相比于其他可能涉及到更广泛认知功能的网络具有较单一的功能,意味着AUD在大脑整体信息处理过程中并不是枢纽网络.从疾病进展上分析,也有可能是MCI患者向阿尔兹海默症(Alzheimer’s Disease,AD)转换进程中,AUD网络受损对整体功能网络影响较小,而其他子网络可能会更早或更显著的受到损坏;
(5)聚类系数在全脑及SUB、VIS、AUD、SEN四个子网中呈现出显著性差异,并且MCI组的网络聚类系数要低于NC组,说明MCI组网络可能存在部分结构的缺失或损坏.
综合所有指标结果来看,阻滞系数指标和平均路径长度指标在所有指标中差异性最明显,且它们之间存在对照关系,可能成为MCI早期诊断和疾病进展监测的生物标记物.平均转换时间指标呈现出的差异性并不广泛,但其与小世界属性在相同的子网络中呈现出差异性,说明脑功能网络呈现出小世界网络特征可能与功能网络活跃程度有关.已有研究广泛认为人脑具有小世界网络特征[31],本文提出的平均转换时间指标揭示出MCI患者功能网络活跃程度降低可能破坏其小世界网络特征,这是以往图论研究中少有提出的结论.
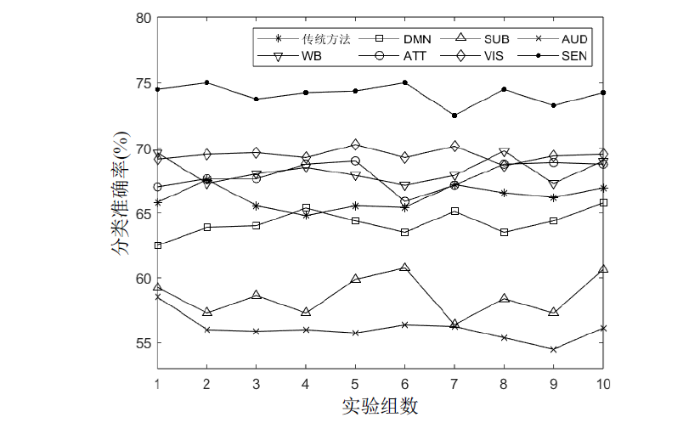
2.5 分类实验结果
分别以传统方法中的FC、全脑及各功能子网络的图论指标为分类特征,开展分类实验,其中全脑采用表6中所有图论指标,各功能子网络采用表7中对应网络的所有图论指标.使用SVM进行10组5折交叉验证实验,每组重复实验10次,图7为每组重复实验取均值的结果,表9为这100次分类实验取均值的数值结果,其中WB为全脑分类结果.从图7和表9中可以看到,构建高阶脑网络并提取网络的多种图论指标的方法在全脑及ATT、VIS、SEN三个子网络上的分类性能优于传统方法,其中SEN子网络分类准确率最高,为74.1%,相比传统FC分析方法提升了8%.在全脑、ATT、VIS上的分类准确率分别比传统FC分析方法高出2.1%、1.8%、3.3%.在DMN、SUB、AUD三个子网络上的分类准确率低于传统方法,尽管子网络的部分图论指标能体现组间差异,但这些指标可能不足以全面捕捉到区分类别所需的信息.综上,高阶网络图论分析能够取得有意义的分类结果,在SEN子网络中分类性能的优势较为明显.
表9 各方法分类结果均值
Table 9
| ACC | SEN | SPN | AUC | |
|---|---|---|---|---|
| 传统方法 | 66.1% | 0.627 | 0.696 | 0.807 |
| WB | 68.2% | 0.633 | 0.730 | 0.858 |
| DMN | 64.2% | 0.603 | 0.681 | 0.854 |
| ATT | 67.9% | 0.646 | 0.692 | 0.802 |
| SUB | 58.5% | 0.585 | 0.595 | 0.784 |
| VIS | 69.4% | 0.719 | 0.669 | 0.897 |
| AUD | 56.0% | 0.539 | 0.581 | 0.725 |
| SEN | 74.1% | 0.730 | 0.752 | 0.927 |
图7
2.6 讨论
在本次研究中,建立高阶FC网络并提出新的时变图论指标对MCI患者脑网络时变状态进行分析.与传统的图论方法相比,高阶FC图论网络中的每个节点代表脑区间的静态关联信息,边的连接代表不同时间窗口之间的动态关联信息,呈现出多时间尺度下的脑区协同过程,为图论在神经影像领域的应用提供了新的思路.本文提出阻滞系数和平均转换时间两个新的图论指标能够对高阶FC网络的时间变异性进行定量表达,可有效用于MCI组和NC组的差异性分析,为MCI疾病相关的生物标志物研究提供新的见解.
在现有研究中,Li等[33]发现AD患者的大脑活动状态往往比NC受试者的大脑活动状态保持更长时间,且DMN子网络的动态变化差异最显著.Chen等[34]的研究表明,楔前叶的萎缩可能对应于DMN的功能恶化.在针对MCI发展进程的研究表明[25],子网络的特征变化趋势显示出两种不同的模式,其中DMN、VIS、SUB、AUD四个子网络的特征随着病情发展呈递增后递减的模式,呈倒U型趋势,ATT和SEN子网络呈持续下降趋势.本文的研究方法在实验中获得了较好的验证结果,部分实验结果与现有研究结果吻合,具体如下:(1)在高阶FC网络中存在FCR现象,表现为在较长连续时间段内的LoFC保持高度相关现象,且在MCI组中会更加严重.MCI组的平均转换时间整体高于NC组,状态转换所需时间更长,脑功能网络活跃度低,与前人研究中发现AD患者大脑活动状态比NC受试者能保持更长时间的结论相吻合.根据既往研究[33],AD患者的DMN子网络的动态变化差异最显著,而本文在AD前驱期MCI中的研究发现DMN在所有子网络中并不具有最显著的差异,表明MCI向AD发展过程中可能导致DMN子网络的功能丧失.(2)各功能子网络中SEN子网络可能在疾病发展过程中最先受损,AUD子网络的功能更为独立化,在大脑功能网络中可能不占据重要位置,且脑功能网络的活跃程度会影响其表现出小世界网络的特征.本文实验中,子网络的差异性主要体现在ATT、VIS、SEN三个子网络上,与既往研究[25]中发现的ATT和SEN子网络功能的持续下降结论相吻合,且在本文的实验中新发现了疾病组中VIS子网络存在异常的现象.实验中仍有部分问题值得进一步讨论:(1)本研究中提出的阻滞系数和平均转换时间两个图论指标,专门设计用于捕捉和分析高阶动态FC网络中的时间变异性,但它们可能不适用于传统的低阶FC网络,因为低阶FC网络通常不涉及时间尺度.这种特定的应用场景具有针对性,未来研究可以探索如何将这些指标扩展到低阶FC网络或其他神经影响数据中去.(2)由于本文工作重心为图论在高阶FC网络的应用,SWC参数及Glasso中罚参数的设置参考了已有研究的经验值,参数的变动对网络模型的影响并未进行论证,未来的工作中需要进一步探索.(3)DMN、SUB、AUD三个子网络的分类性能低于传统方法,高阶网络中可能蕴含其他关键信息,有待开发更多指标进行表达.
3 结论
本文在高阶动态功能连接中应用图论研究了MCI患者和NC被试在高阶脑网络的时间变异性差异.首先提取被试的HodFC信息并对其完成高阶FC网络的构建;然后定义了两个新的图论指标,即阻滞系数和平均转换时间,以表征高阶FC网络的时间变异性,同时结合传统图论指标在全脑及各功能子网络中进行MCI组和NC组的差异性分析;最后根据被试的多种图论指标进行分类实验,并与传统FC分析方法进行对比.
通过实验得到如下结论:(1)在高阶FC网络分析中,MCI患者呈现出显著的FCR现象,即MCI患者的LoFC在较长时间内维持高度相关性,活跃度低,NC组中也会出现FCR现象,但LoFC高度相关的邻接节点较少,持续时间较短.严重的FCR会导致MCI患者在较长时间的瞬时工作状态均相似,状态转换受阻致使其转换所需时间更长;(2)在全脑高阶网络分析中,本文提出的阻滞系数指标和平均转换时间指标均能呈现出显著性差异,且实验发现小世界属性在高阶FC网络中的适用性有所降低;(3)在功能子网络的分析中,SEN子网络在所有子网络中具有最高的敏感性和区分度,表明MCI疾病可能与感觉运动功能的早期受损有关,AUD子网络在整体脑功能网络中的作用可能较小,脑功能网络的活跃性会影响其小世界网络特征的表现.(4)分类实验结果表明,构建高阶脑网络并提取网络的多种图论指标的方法在全脑及ATT、VIS、SEN三个子网络上的分类性能优于传统FC分析方法,相比传统FC分析方法66.1%的分类准确率分别高出2.1%、1.8%、3.3%、8%.
利益冲突
无
参考文献
Mild cognitive impairment: transition between aging and Alzheimer’s disease
[J].
Mild cognitive impairment
[J].
Multivoxel pattern analysis for FMRI data: a review
[J].
Resting-state fMRI changes in Alzheimer’s disease and mild cognitive impairment
[J].
Dynamic functional connectivity: Promise, issues, and interpretations
[J].
DOI:10.1016/j.neuroimage.2013.05.079
PMID:23707587
[本文引用: 1]

The brain must dynamically integrate, coordinate, and respond to internal and external stimuli across multiple time scales. Non-invasive measurements of brain activity with fMRI have greatly advanced our understanding of the large-scale functional organization supporting these fundamental features of brain function. Conclusions from previous resting-state fMRI investigations were based upon static descriptions of functional connectivity (FC), and only recently studies have begun to capitalize on the wealth of information contained within the temporal features of spontaneous BOLD FC. Emerging evidence suggests that dynamic FC metrics may index changes in macroscopic neural activity patterns underlying critical aspects of cognition and behavior, though limitations with regard to analysis and interpretation remain. Here, we review recent findings, methodological considerations, neural and behavioral correlates, and future directions in the emerging field of dynamic FC investigations. Copyright © 2013 Elsevier Inc. All rights reserved.
Assessing uncertainty in dynamic functional connectivity
[J].
DOI:S1053-8119(17)30065-4
PMID:28132931
[本文引用: 2]
Functional connectivity (FC) - the study of the statistical association between time series from anatomically distinct regions (Friston, 1994, 2011) - has become one of the primary areas of research in the field surrounding resting state functional magnetic resonance imaging (rs-fMRI). Although for many years researchers have implicitly assumed that FC was stationary across time in rs-fMRI, it has recently become increasingly clear that this is not the case and the ability to assess dynamic changes in FC is critical for better understanding of the inner workings of the human brain (Hutchison et al., 2013; Chang and Glover, 2010). Currently, the most common strategy for estimating these dynamic changes is to use the sliding-window technique. However, its greatest shortcoming is the inherent variation present in the estimate, even for null data, which is easily confused with true time-varying changes in connectivity (Lindquist et al., 2014). This can have serious consequences as even spurious fluctuations caused by noise can easily be confused with an important signal. For these reasons, assessment of uncertainty in the sliding-window correlation estimates is of critical importance. Here we propose a new approach that combines the multivariate linear process bootstrap (MLPB) method and a sliding-window technique to assess the uncertainty in a dynamic FC estimate by providing its confidence bands. Both numerical results and an application to rs-fMRI study are presented, showing the efficacy of the proposed method.Copyright © 2017 Elsevier Inc. All rights reserved.
Short-time windows of correlation between large-scale functional brain networks predict vigilance intraindividually and interindividually
[J].
DOI:10.1002/hbm.22140
PMID:22736565
[本文引用: 1]
A better understanding of how behavioral performance emerges from interacting brain systems may come from analysis of functional networks using functional magnetic resonance imaging. Recent studies comparing such networks with human behavior have begun to identify these relationships, but few have used a time scale small enough to relate their findings to variation within a single individual's behavior. In the present experiment we examined the relationship between a psychomotor vigilance task and the interacting default mode and task positive networks. Two time-localized comparative metrics were calculated: difference between the two networks' signals at various time points around each instance of the stimulus (peristimulus times) and correlation within a 12.3-s window centered at each peristimulus time. Correlation between networks was also calculated within entire resting-state functional imaging runs from the same individuals. These metrics were compared with response speed on both an intraindividual and an interindividual basis. In most cases, a greater difference or more anticorrelation between networks was significantly related to faster performance. While interindividual analysis showed this result generally, using intraindividual analysis it was isolated to peristimulus times 4 to 8 s before the detected target. Within that peristimulus time span, the effect was stronger for individuals who tended to have faster response times. These results suggest that the relationship between functional networks and behavior can be better understood by using shorter time windows and also by considering both intraindividual and interindividual variability.Copyright © 2012 Wiley Periodicals, Inc.
Sparse temporally dynamic resting-state functional connectivity networks for early MCI identification
[J].
Dynamic functional connectivity analysis reveals transient states of dysconnectivity in schizophrenia
[J].
Principal components of functional connectivity: A new approach to study dynamic brain connectivity during rest
[J].
DOI:10.1016/j.neuroimage.2013.07.019
PMID:23872496
[本文引用: 1]
Functional connectivity (FC) as measured by correlation between fMRI BOLD time courses of distinct brain regions has revealed meaningful organization of spontaneous fluctuations in the resting brain. However, an increasing amount of evidence points to non-stationarity of FC; i.e., FC dynamically changes over time reflecting additional and rich information about brain organization, but representing new challenges for analysis and interpretation. Here, we propose a data-driven approach based on principal component analysis (PCA) to reveal hidden patterns of coherent FC dynamics across multiple subjects. We demonstrate the feasibility and relevance of this new approach by examining the differences in dynamic FC between 13 healthy control subjects and 15 minimally disabled relapse-remitting multiple sclerosis patients. We estimated whole-brain dynamic FC of regionally-averaged BOLD activity using sliding time windows. We then used PCA to identify FC patterns, termed "eigenconnectivities", that reflect meaningful patterns in FC fluctuations. We then assessed the contributions of these patterns to the dynamic FC at any given time point and identified a network of connections centered on the default-mode network with altered contribution in patients. Our results complement traditional stationary analyses, and reveal novel insights into brain connectivity dynamics and their modulation in a neurodegenerative disease. © 2013 Elsevier Inc. All rights reserved.
A wavelet-based approach for estimating time-varying connectivity in resting-state fMRI
[J].
DOI:10.1089/brain.2021.0015
PMID:34155908
[本文引用: 1]
The selection of an appropriate window size, window function and functional connectivity (FC) metric in the sliding window method, is not straightforward due to the absence of ground truth.A previously proposed wavelet-based method was accordingly adjusted for estimating time-varying functional connectivity (TVFC) and was applied on a large high-quality, low-motion dataset of 400 resting-state fMRI data. Specifically, the wavelet coherence magnitude and relative phase were averaged across wavelet (frequency) scales to yield TVFC and synchronization patterns. To assess whether the observed fluctuations in TVFC were statistically significant (dynamic FC [dFC]; the distinction between TVFC and dFC is intentional), surrogate data were generated using the multivariate Phase (MVPR) and multivariate Auto-regressive Randomization (MVAR) methods to define the null hypothesis of dFC absence.By averaging across all frequencies, core regions of the Default Mode Network (DMN; medial prefrontal and posterior cingulate cortices, inferior parietal lobes, hippocampal formation) were found to exhibit dFC (test-retest reproducibility of 90%) and were also synchronized in activity (-15°≤phase≤15°). When averaging across distinct frequency bands, the same dynamic connections were identified, with the majority of them identified in the frequency range (0.01, 0.198] Hz, though with lower test-retest reproducibility (<66%). Additional analysis suggested that MVPR method better preserved properties (p<10), including time-averaged coherence, of the original data compared to MVAR approach.The wavelet-based approach identified dynamic associations between the core DMN regions with fewer choices in parameters, compared to sliding window method.
Enhanced resting-state functional connectivity between core memory-task activation peaks is associated with memory impairment in MCI
[J].
DOI:S0197-4580(16)30055-0
PMID:27459924
[本文引用: 1]
Resting-state functional connectivity (FC) is altered in Alzheimer's disease (AD) but its predictive value for episodic memory impairment is debated. Here, we aimed to assess whether resting-state FC in core brain regions activated during memory-task functional magnetic resonance imaging is altered and predictive of memory performance in AD and amnestic mild cognitive impairment (aMCI). Twenty-three elderly cognitively healthy controls (HC), 76 aMCI subjects, and 19 AD dementia patients were included. We computed resting-state FC between 18 meta-analytically determined peak coordinates of brain activation during successful memory retrieval. Higher FC between the parahippocampus, parietal cortex, and the middle frontal gyrus was observed in both AD and mild cognitive impairment compared to HC (false-discovery rate-corrected p < 0.05). The increase in FC between the parahippocampus and middle frontal gyrus was associated with reduced episodic memory in aMCI, independent of amyloid-beta positron emission tomography binding and apolipoprotein E ε4-carrier status. In conclusion, increased parahippocampal-prefrontal FC is predictive of impaired episodic memory in aMCI and may reflect a dysfunctional change within the episodic memory-related neural network.Copyright © 2016 Elsevier Inc. All rights reserved.
High-order resting-state functional connectivity network for MCI classification
[J].
DOI:10.1002/hbm.23240
PMID:27144538
[本文引用: 2]
Brain functional connectivity (FC) network, estimated with resting-state functional magnetic resonance imaging (RS-fMRI) technique, has emerged as a promising approach for accurate diagnosis of neurodegenerative diseases. However, the conventional FC network is essentially low-order in the sense that only the correlations among brain regions (in terms of RS-fMRI time series) are taken into account. The features derived from this type of brain network may fail to serve as an effective disease biomarker. To overcome this drawback, we propose extraction of novel high-order FC correlations that characterize how the low-order correlations between different pairs of brain regions interact with each other. Specifically, for each brain region, a sliding window approach is first performed over the entire RS-fMRI time series to generate multiple short overlapping segments. For each segment, a low-order FC network is constructed, measuring the short-term correlation between brain regions. These low-order networks (obtained from all segments) describe the dynamics of short-term FC along the time, thus also forming the correlation time series for every pair of brain regions. To overcome the curse of dimensionality, we further group the correlation time series into a small number of different clusters according to their intrinsic common patterns. Then, the correlation between the respective mean correlation time series of different clusters is calculated to represent the high-order correlation among different pairs of brain regions. Finally, we design a pattern classifier, by combining features of both low-order and high-order FC networks. Experimental results verify the effectiveness of the high-order FC network on disease diagnosis. Hum Brain Mapp 37:3282-3296, 2016. © 2016 Wiley Periodicals, Inc.© 2016 Wiley Periodicals, Inc.
Hybrid high-order functional connectivity networks using resting-state functional MRI for mild cognitive impairment diagnosis
[J].
Research progress of brain structure and functional network based on graph theory analysis in Alzheimer’s disease and Mild cognitive impairment
[J].
阿尔茨海默病和轻度认知障碍中基于图论分析的脑结构和脑功能网络研究进展
[J].
Neurophysiological architecture of functional magnetic resonance images of human brain
[J].
Small-world networks and functional connectivity in Alzheimer’s disease
[J].
Graph theory network construction method and classification of high-order dynamic functional connectivity in MCI patients
[J].
MCI患者高阶动态功能连接的图论网络构建方法及分类
[J].
Predicting conversion from MCI to AD using resting-state fMRI, graph theoretical approach and SVM
[J].
DPABI: Data processing & analysis for (resting-state) brain imaging
[J].
Decreased small-world functional network connectivity and clustering across resting state networks in schizophrenia: An fMRI classification tutorial
[J].
DOI:10.3389/fnhum.2013.00520
PMID:24032010
[本文引用: 1]
Functional network connectivity (FNC) is a method of analyzing the temporal relationship of anatomical brain components, comparing the synchronicity between patient groups or conditions. We use functional-connectivity measures between in dependent components to classify between Schizophrenia patients and healthy controls during resting-state. Connectivity is measured using a variety of graph-theoretic connectivity measures such as graph density, average path length, and small-worldness. The Schizophrenia patients showed significantly less clustering (transitivity) among components than healthy controls (p < 0.05, corrected) with networks less likely to be connected, and also showed lower small world connectivity than healthy controls. Using only these connectivity measures, an SVM classifier (without parameter tuning) could discriminate between Schizophrenia patients and healthy controls with 65% accuracy, compared to 51% chance. This implies that the global functional connectivity between resting state networks is altered in Schizophrenia, with networks more likely to be disconnected and behave dissimilarly for diseased patients. We present this research finding as a tutorial using the publicly available COBRE dataset of 146 Schizophrenia patients and healthy controls, provided as part of the 1000 Functional Connectomes Project. We demonstrate preprocessing, using independent component analysis (ICA) to nominate networks, computing graph-theoretic connectivity measures, and finally using these connectivity measures to either classify between patient groups or assess between-group differences using formal hypothesis testing. All necessary code is provided for both running command-line FSL preprocessing, and for computing all statistical measures and SVM classification within R. Collectively, this work presents not just findings of diminished FNC among resting-state networks in Schizophrenia, but also a practical connectivity tutorial.
Altered functional connectivity in early Alzheimer’s disease: a resting-state fMRI study
[J].
Investigation of the effective connectivity of resting state networks in Alzheimer’s disease: a functional MRI study combining independent components analysis and multivariate Granger causality analysis
[J].
Effective connectivity evaluation of resting-state brain networks in Alzheimer’s disease, amnestic mild cognitive impairment, and normal aging: An exploratory study
[J].
Functional evolving patterns of cortical networks in progression of Alzheimer's disease: a graph-based resting-state fMRI Study
[J].
Sparse inverse covariance estimation with the graphical lasso
[J].
Influence of epoch length on measurement of dynamic functional connectivity in wakefulness and behavioural validation in sleep
[J].
DOI:S1053-8119(15)00171-8
PMID:25765256
[本文引用: 1]
Conventional functional connectivity (FC) analysis of fMRI data derives a single measurement from the entire scan, generally several minutes in duration, which neglects the brain's dynamic behaviour and potentially loses important temporal information. Short-interval dynamic FC is an attractive proposition if methodological issues can be resolved and the approach validated. This was addressed in two ways; firstly we assessed FC of the posterior cingulate cortex (PCC) node of the default mode network (DMN) using differing temporal intervals (8s to 5min) in the waking-resting state. We found that 30-second intervals and longer produce spatially similar correlation topography compared to 15-minute static FC measurements, while providing increased temporal information about changes in FC that were consistent across interval lengths. Secondly, we used NREM sleep as a behavioural validation for the use of 30-second temporal intervals due to the known fMRI FC changes with sleep stage that have been observed in previous studies using intervals of several minutes. We found significant decreases in DMN FC with sleep depth which were most pronounced during stage N2 and N3. Additionally, both the proportion of time with strong PCC-DMN connectivity and the variability in dynamic FC decreased with sleep. We therefore show that dynamic FC with epochs as short as tens of seconds is a viable method for characterising intrinsic brain activity. Copyright © 2015 Elsevier Inc. All rights reserved.
Ranking regions, edges and classifying tasks in functional brain graphs by sub-graph entropy
[J].
The altered temporal properties of dynamic functional connectivity associated with suicide attempt in bipolar disorders
[J].
Dynamic functional connectivity in pediatric mild traumatic brain injury
[J].
A comparative study of structural and metabolic brain networks in patients with mild cognitive impairment
[J].
Group similarity constraint functional brain network estimation for mild cognitive impairment classification
[J].
Triple-network analysis of Alzheimer’s disease based on the energy landscape
[J].
Structural, static, and dynamic functional MRI predictors for conversion from mild cognitive impairment to Alzheimer’s disease: Inter-cohort validation of Shanghai memory study and ADNI
[J].
