


引言
阻塞性和限制性肺部疾病,如肺气肿、哮喘和囊性纤维化等,对肺通气产生不利影响,从而损害局部肺通气功能[1].因此,局部肺通气功能的无创评估对于量化疾病的严重程度、评估对治疗的反应和预测临床结果至关重要.肺功能检查(Pulmonary Function Tests,PFTs)提供了一种平价的肺功能测量方法,但是它仅提供肺功能的整体测量,无法评估肺功能的区域改变[2].计算机断层扫描(Computed Tomography,CT)是目前临床上检测肺部疾病最常用的影像学方法,其分辨率可以识别至第6~10级支气管[3],但对外周小气道的敏感性较低.由于CT可以识别肺裂,因此可以进行肺叶水平的分析.结合两次屏气CT扫描(呼气末和吸气末)结果及计算流体力学可获得肺叶水平通气信息,可作为通气的替代指标[4],但是两次曝光显然会增加辐射剂量.
超极化129Xe磁共振成像(Hyperpolarized 129Xe Magnetic Resonance Imaging,129Xe MRI)是一种新兴的肺部成像技术[5⇓-7].129Xe气体被吸入后,由支气管进入肺内到达远端细支气管,对肺内的该气体进行磁共振成像便可实现肺部通气功能的可视化.由于无电离辐射,该方法在健康受试者和肺部疾病患者中耐受性良好[8,9],在了解某些肺部疾病的病理生理学以及药物治疗方面具有巨大的潜力.根据报道,哮喘患者经过贝那利珠单抗剂量治疗后,129Xe MRI显示肺部通气缺陷显著减少[10].Harkiran等人报道感染COVID-19患者的通气功能在15个月后比3个月后有着显著的改善[11].Li等人使用129Xe MRI报道了COVID-19 出院患者因通气不良或气体交换障碍或两者兼而有之引起的低氧血症[12,13].综上所述,129Xe MRI对于肺部疾病的监测具有重大的临床意义.
在医学影像学中,通常将来自不同影像模态(如MRI、CT、PET、SPECT等)的图像数据结合起来,以提供更全面的解剖和功能信息,该方法称为多模态配准.例如,将单光子发射断层显像(Single Photon Emission Computed Tomography,SPECT)与低剂量CT相结合,能够提供肺叶水平通气和灌注的三维功能图[14],然而与129Xe MRI相比,SPECT具有较低的空间分辨率,且不能在单次屏气中获取图像.正电子发射断层扫描(Positron Emission Tomography,PET)与CT的结合,能够获得器官和病变的代谢信息[15].但是由于辐射剂量高且分辨率较低,限制了其在临床上的广泛应用.此外,已有研究报道129Xe MRI与CT结合,获得肺叶水平通气功能信息,与定量CT获得的肺气肿百分比相关[16].
然而,CT上的影像学病灶与129Xe MRI上的通气异常间的内在联系尚未研究清楚.因此,本研究通过将CT图像与129Xe MRI图像进行配准,探究气体MRI获得的肺通气功能与CT病灶类型之间的关联.
1 试验部分
1.1 受试者纳入和排除标准
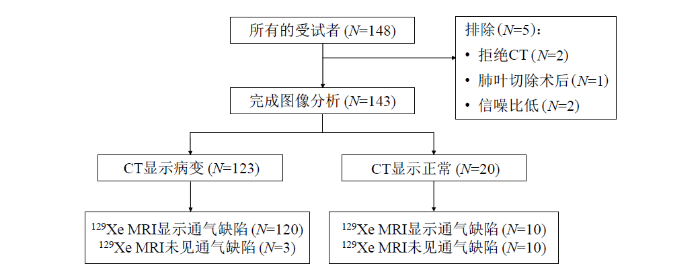
本临床试验已通过中国科学院精密测量科学与技术创新研究院伦理委员会的批准(APMH22005A).参与本次研究的所有受试者都签订了知情同意书.招募标准为:年龄18~80岁,无磁共振禁忌症(如带有心脏起搏器,植入人工金属心脏瓣膜,体内有金属异物、金属植入物或金属假体等,危重症患者,癫痫患者,幽闭恐惧症患者等),受试者的纳入和排除流程如图1所示.148例受试者中有2例拒绝CT,1例因肺癌行肺叶切除术,2例因129Xe MRI的图像信噪比低被排除,最终共有143例受试者的数据用于129Xe MRI和CT的多模态图像配准分析.
图1
1.2 MRI和CT扫描
所有受试者均在同一天进行PFTs、CT和MRI扫描,以确保受试者在进行各项检查时的生理状态一致.第一秒用力呼气量(FEV1)、用力肺活量(FVC)和FEV1/FVC的百分比预计值根据全球肺功能倡议(Global Lung Function Initiative)的参考值生成[19].CT图像采用西门子64排或东软64排获取.受试者均采用仰卧位,在吸气末屏气下扫描,扫描时的肺容积为功能残气量(FRC)+潮气量.扫描参数如下:管电压=120/130 kV,自动管电流调制,矩阵=512×512,层厚=5 mm.
基于自旋交换光抽运(Spin-Exchange Optical Pumping,SEOP)技术,使用商用的超极化气体发生器(verImagin Healthcare,中国)对129Xe气体进行超极化,所用的气源是富集氙(129Xe富集度为86%)混合气体.超极化后的129Xe首先在液氮和磁场包围的冷阱内进行冷冻储存.MRI数据采集前,将冷阱置入温水中进行129Xe冰升华.升华后的129Xe气体收集于Tedlar采样袋中.
1H和129Xe MRI 均在3.0 T人体成像仪[uMR780(Xe),verImagin Healthcare,中国]进行.129Xe MRI使用自制的发射/接收一体的柔性马甲肺部线圈,扫描前该线圈调谐频率至35.49 MHz.1H MRI使用3.0 T人体成像仪配套的体线圈.受试者需要在操作人员的指令下吸入400 mL超极化129Xe和400 mL高纯N2气后屏住呼吸,1H和129Xe MRI均在这次屏气内完成扫描,用时分别是4 s和10 s.扫描时的肺容积为FRC+800 mL.
129Xe MRI通气像采用bSSFP序列,参数如下:冠状位图像,TR=5.3 ms,TE=2.65 ms,矩阵=96×96,视野大小=380×380 mm2,层数=20,层厚=9 mm,翻转角=8˚,带宽=800 Hz.1H MRI采用2D GRE序列,参数如下:冠状位图像,TR=4.3 ms,TE=2.02 ms,翻转角=20˚,带宽=1 500 Hz,其他参数与bSSFP序列保持一致.在进行129Xe MRI扫描前后,测量受试者的血压和外周血毛细血管氧饱和度(SPO2).
1.3 图像处理
CT图像的诊断报告是由2名经验丰富的放射科医师完成.CT肺窗的窗宽为1 500~2 000 HU(Hounsfield Unit)、窗位为-450 ~ -600 HU.根据影像学征象将肺部疾病类型分为感染性病变、肺气肿/肺大疱、纤维化、结节、混合疾病(单个肺叶中有两种及两种以上的病灶).
通气缺陷的定性和定量评估由2名具有2年以上的医学图像处理经验的操作人员使用ITK-SNAP工具包完成.通气缺陷定义为肺内出现信号完全缺失或信号强度明显低于周围肺组织,不考虑与血管、心脏和纵隔相关的信号缺失[20].对于采集到的129Xe MRI通气像和1H MRI胸腔像的原始数据,先通过傅里叶变换得到图像.由于在单次屏气内采集,两种图像不需要配准.分别通过K-means聚类、种子生长法对129Xe MRI肺部图像和1H MRI胸腔图像进行分割,得到肺部和胸腔的二值化掩膜(mask),结合胸腔掩膜将肺部外的背景区域去除,最终获得肺部通气分布图,计算肺部通气缺陷体积与胸腔总体积的比值得到通气缺陷百分比(Ventilation Defect Percentage,VDP)[21].
MRI和CT图像的分割和配准由1名具有5年医学图像处理经验的操作人员完成.首先,使用uAI软件(联影,中国上海)生成CT肺边界和每个肺叶的掩膜.然后,使用ANTs软件包先进行原始图像配准,为了使得掩膜边缘具有更好的一致性,进一步进行了掩膜配准(二次配准).接着,将配准过程中获得的形变变换应用于原始CT图像,从而将肺叶掩膜与129Xe MRI配准,最终获得每个肺叶的通气功能信息[22].
1.4 肺叶分析
我们统计了每一个肺叶的CT病灶类型及129Xe MRI通气情况,并对每个肺叶进行了CT病灶类型与129Xe MRI通气情况的对应分析,主要分为四类:既无CT病灶又无通气异常,无CT病灶有通气异常,有CT病灶无通气异常,既有CT病灶又有通气异常.CT正常标准是双侧胸廓对称,双肺纹理清晰,未见明显异常高低密度影;双肺门不大,气管及支气管通畅;纵膈居中,内未见明显肿大淋巴结;双侧未见胸腔积液,胸膜未见明显增厚.129Xe MRI正常标准是不存在通气缺陷,异常标准为出现通气缺陷区域.
1.5 空间一致性分析
局部通气缺陷与CT病灶的空间对应关系分析方法为:对每一个肺叶,统计CT病灶,通气缺陷的大小和位置以及两者的重叠程度.该工作由2名放射科医师和1名图像处理人员使用4分量表[18]完成:0分表示CT上无病变,1分表示CT上有病变区域,但与通气缺陷的区域无重叠,2分表示CT上有病变区域,且与通气缺陷的区域有26%~50%重叠,3分表示CT上有病变区域,且与通气缺陷的区域有51%~75%重叠,4分表示CT上有病变区域,且与通气缺陷的区域有>75%重叠.取三人的平均值,评分>2.5分视为单个肺叶上的CT病变区域与通气缺陷的区域对应性良好;反之,评分≤2.5分视为单个肺叶上的CT病变区域与通气缺陷的区域对应性较差.
通气缺陷概率(
1.6 统计学分析
所有统计学分析均在SPSS软件(IBM SPSS Statistics 27,Armonk,NY,USA)上进行.
以CT的不同病灶(感染性病变、肺气肿/肺大疱、纤维化、结节、支气管扩张、肺气囊、占位性病变)的有无为自变量,129Xe MRI上通气缺陷的有无作为结局变量,对不同肺叶进行二分类逻辑回归分析,以产生比值比(Odds Ratios,OR).由于肺气囊、占位性病变的样本量较少,所以被排除.另外还将年龄、性别和体质指数(Body Mass Index,BMI)考虑在内.若OR值大于1,表明该自变量为危险因素;若OR值小于1,表明该自变量为保护因素;若OR值等于1,表明自变量对结局不起作用.P < 0.05被视为具有统计学意义.所有数据的图表均在GraphPad Prism 9.3软件(GraphPad software Inc. La Jolla,California,USA)上完成.
2 结果与讨论
2.1 志愿者基本信息
最终143例受试者的人口统计学、呼吸问卷和129Xe MRI的结果见表1.需要注意的是,有1例受试者BMI数据遗漏,7例受试者肺功能测试配合度差,6例受试者呼吸问卷数据遗漏,因此表格中的这些参数排除了部分数据.除了男性人数外,所有数据结果以“均值±标准差”的形式呈现.在143例受试者中,123例CT上显示病变(其中120例也在129Xe MRI上显示存在通气缺陷),20例CT显示正常(其中10例在129Xe MRI上显示存在通气缺陷).
表1 受试者的基本信息、PFTs、呼吸问卷和129Xe MRI结果
Table 1
| 基本信息 | CT异常(n=123) | CT正常(n=20) |
|---|---|---|
| 年龄 | 57.5 ± 12.7 | 43.3 ± 13.4 |
| 男性人数 | 79 (64.2%) | 13 (65.0%) |
| BMI | 24.8 ± 3.4 | 24.3 ± 3.2 |
| PFTs | ||
| FEV1%pred | 105.0 ± 14.4 | 107.3 ± 12.8 |
| FVC%pred | 107.3 ± 14.1 | 112.5 ± 13.3 |
| FEV1/FVC%pred | 94.9 ± 6.0 | 95.2 ± 4.8 |
| RV%pred | 86.7 ± 22.8 | 102.6 ± 20.2 |
| TLC%pred | 89.9 ± 12.6 | 96.8 ± 8.8 |
| RV/TLC%pred | 93.8 ± 18.5 | 104.8 ± 16.3 |
| FRC%pred | 100.5 ± 22.1 | 112.7 ± 12.1 |
| PEF%pred | 111.7 ± 22.0 | 99.0 ± 17.1 |
| 呼吸问卷 | ||
| SGRQ评分 | 12.0 ± 13.7 | 8.8 ± 10.9 |
| 129Xe MRI | ||
| 全局VDP(%) | 4.6 ± 3.0 | 3.2 ± 1.6 |
注:BMI,体质指数;FEV1,第一秒用力呼气量;FVC,用力肺活量;RV,余气量;TLC,肺总量;FRC,功能余气量;PEF,呼气峰流量;%pred,实际值占预测值的百分比;SGRQ,圣乔治呼吸问卷;VDP,通气缺陷百分比.
2.2 肺叶分析结果
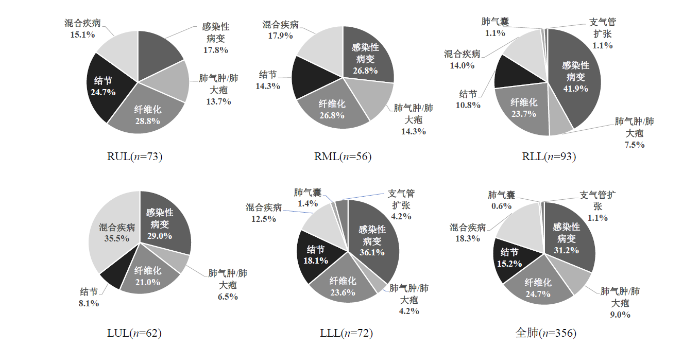
共计715个肺叶被用来分析评估,其中356个肺叶存在病变.图2展示了CT病灶类型肺叶中的所占百分比,RUL、RML、RLL、LUL、LLL分别代表右肺上叶、右肺中叶、右肺下叶、左肺上叶、左肺下叶.其中,全肺感染性病变占31.2%,纤维化占24.7%,混合疾病占18.3%,结节占15.2%,肺气肿/肺大疱占9.0%,支气管扩张占1.1%,肺气囊占0.6%.
图2
如表2所示,715个肺叶中,533个肺叶(74.6%)CT和129Xe MRI的结果一致,其中260个肺叶(36.4%)既在CT上存在病变又在129Xe MRI上存在通气缺陷,273个肺叶(38.2%)在129Xe MRI和CT上均显示正常.只有一小部分肺叶(12.0%+13.4%=25.4%)129Xe MRI和CT出现相反的结果.
表2 肺叶结构-功能信息表
Table 2
| CT(0)-129Xe MRI(0) | CT(0)-129Xe MRI(1) | CT(1)-129Xe MRI(0) | CT(1)-129Xe MRI(1) | |
|---|---|---|---|---|
| RUL | 54(37.8%) | 16(11.1%) | 15(10.5%) | 58(40.6%) |
| RML | 74(51.7%) | 13(9.1%) | 18(12.6%) | 38(26.6%) |
| RLL | 43(30.0%) | 7(4.9%) | 32(22.4%) | 61(42.7%) |
| LUL | 49(34.3%) | 32(22.3%) | 10(7.0%) | 52(36.4%) |
| LLL | 53(37.1%) | 18(12.6%) | 21(14.7%) | 51(35.7%) |
| 总计 | 273(38.2%) | 86(12.0%) | 96(13.4%) | 260(36.4%) |
注:CT(m)-129Xe MRI(m),m=0代表正常,m=1代表异常.表格中的数值为肺叶数量,括号内为该肺叶数量在所有肺叶中所占的比例.
图3
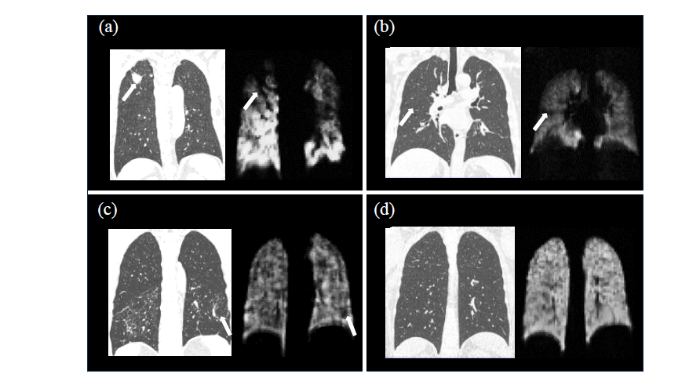
图3
4名受试者(a)~(d)代表性的CT图像和129Xe MRI通气像
Fig. 3
Representative CT images and 129Xe MRI ventilation images of four subjects (a)~(d)
联合分析显示,129Xe MRI通气像和CT在肺部疾病诊断中具有互补性.CT扫描提供了肺部结构的详细信息,而129Xe MRI通气像则提供了肺通气功能的直观评估.在部分志愿者中,CT扫描显示的肺部结构异常与129Xe MRI通气像显示的通气缺陷存在一致性.这表明肺部结构异常可能对肺通气功能产生直接影响.然而,我们也发现了一些肺部结构正常但存在通气缺陷的情况,这提示肺部疾病的病理机制可能更加复杂,需要综合考虑结构和功能两方面的信息.
图4显示了不同肺叶根据各种因素关联的森林图.在大部分肺叶中,感染性病变(P=0.08,OR=3.08;P=0.02,OR=3.86;P<0.001,OR=7.24;P=0.04,OR=2.98;P<0.001,OR=7.13)、肺气肿/肺大疱(P<0.001,OR=19.76;P=0.004,OR=8.30;P=0.005,OR=9.07;P=0.01, OR=14.85;P=0.67,OR=1.46)和纤维化(P<0.001,OR=8.22;P<0.001,OR=11.28; P<0.001,OR=17.49;P=0.04,OR=3.28;P=0.05,OR=2.70)与通气缺陷密切相关.对于左肺下叶,只有感染性病变(P<0.001,OR=7.13)与通气缺陷密切相关.另外,图中还显示了右肺,年龄(P=0.007,OR=1.04;P=0.11,OR=1.03;P=0.003,OR=1.06)与通气缺陷存在轻微正相关;对于右肺上叶BMI(P=0.01,OR=0.86)与通气缺陷存在负相关.
图4
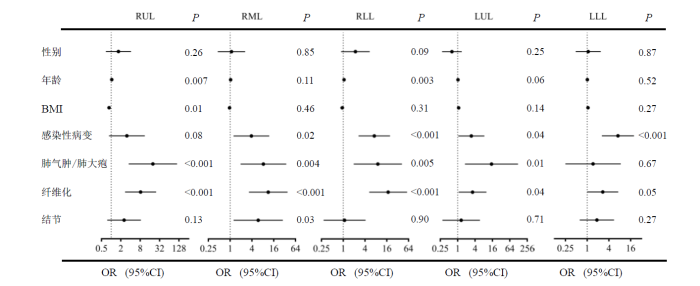
图4
不同肺叶通气缺陷与CT影像学和人口统计学之间关系的森林
Fig. 4
Forest plots for correlations between ventilation defects and CT imaging and demographic in different lung lobes. 95% CI represents 95% confidence interval
2.3 空间一致性分析结果
将CT与129Xe MRI配准后,基于CT上病灶的区域观察129Xe MRI上有无通气缺陷,根据重叠面积评分,>2.5分视为空间一致性良好.图5展示了一名典型受试者(女性,51岁)的左肺CT-129Xe MRI病灶重叠区域:图5(a)是分割的肺叶mask叠加在129Xe MRI的图像上,由此获取肺叶通气功能的信息,蓝色区域是左肺上叶,绿色区域为左肺下叶;图5(b)是左肺的CT图像,标注区域为纤维化的区域;图5(c)是左肺129Xe MRI通气像,标注区域为通气缺陷的区域.对于该患者左肺上叶CT-129Xe MRI病灶重叠面积评分,评估人员1为3分,评估人员2为2分,评估人员3为4分,取平均值最终得分为3分,即视为空间一致性良好.
图5
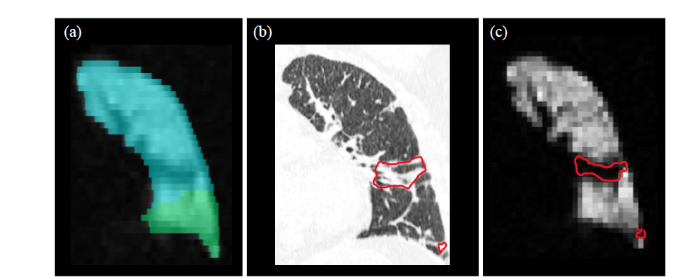
图5
左肺上叶CT-129Xe MRI病灶重叠区域. (a)叠加肺叶mask后的129Xe MRI;(b)肺部CT影像(红色标注区域为病灶区域);(c) 129Xe MRI通气像(红色标注区域为通气缺陷区域)
Fig. 5
CT-129Xe MRI lesion overlap area in left upper lobe. (a) 129Xe MRI overlapped with lung lobe mask; (b) CT image (red areas represent fibrosis areas; (c) 129Xe MRI ventilation image (red areas represent ventilation defect areas)
图6直观地展示了不同肺叶和不同病灶感染对通气功能的影响概率,图中的数值即
图6
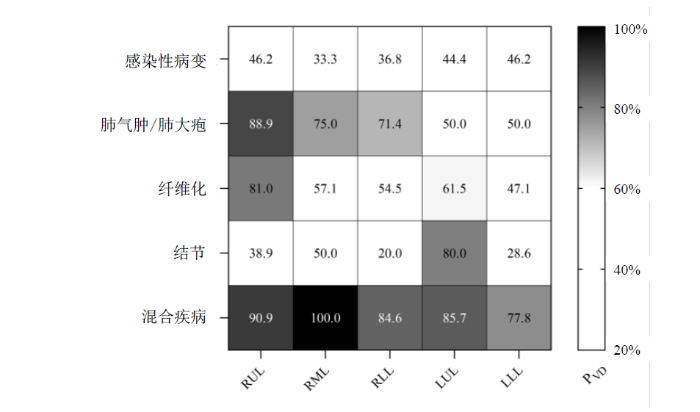
多项研究已证实,基于129Xe MRI技术,可以观察到肺气肿患者存在的局部通气功能障碍,并且这种功能障碍的程度与疾病的严重程度紧密相关,我们的研究结果和前人的报道一致性高[16,21].在本研究中,我们主要关注的是炎症后纤维化(Post-Inflammatory Pulmonary Fibrosis,PPF),这是由病毒性肺炎愈合后遗留下来的,对于炎症吸收后造成的胸膜增厚、钙化灶也被归为纤维化样改变.与特发性纤维化(Idiopathic Pulmonary Fibrosis,IPF)不同,PPF通常在炎症消退后逐渐发展,导致肺组织逐渐变硬,功能下降[23].值得注意的是,肺部感染性病变可能由多种原因引发,例如病毒、细菌、真菌和寄生虫引起的呼吸道感染.在本研究中,虽然受试者的确切病因尚未明确,但也已经造成了一定程度的肺通气功能障碍.通常结节直径小于1 cm被视为小结节,而大于3 cm的结节则被视为肿块.然而,仅有小部分的肺结节可能预示着肺癌或癌前病变[24].我们初步的研究结果表明,肺结节导致通气功能障碍的概率并不高,提示良性的可能性较大.非囊性纤维化支气管扩张症特征是中小型气道不可逆地扩张,伴有炎症、慢性细菌感染和支气管壁破坏.在CT横断面上,当支气管的内径大于它的伴随血管时被称为“印戒征”[25].本研究发现17个肺叶伴随支气管扩张(非囊性纤维化型),但是由于支气管扩张常常并发肺气肿、感染等,因此在进行病灶分类时,绝大部分的支气管扩张纳入混合疾病当中,但是10个(59%)伴有支气管扩张的肺叶存在通气缺陷.左肺下叶的CT病灶造成通气缺陷的概率相对较小,这一发现可能与左肺下叶的解剖位置(离心脏近,受心脏跳动的影响)、结构特点、功能特征以及血液供应等因素有关.病灶的大小、形态以及与周围组织的相互作用也对肺通气功能产生影响.
3 结论
在本次研究中,我们将143名受试者的129Xe MRI通气像和CT图像进行配准,来探究肺部病灶导致的局部肺功能障碍的发生概率.首先对肺部整体的结构和功能进行评估,然后分肺叶进行局部评估,最后对129Xe MRI和CT进行了空间一致性分析.结果发现:(1)143名受试者中有13例受试者肺部整体的CT和129Xe MRI结果完全相反;(2)715个肺叶中,大部分肺叶(74.6%)在129Xe MRI和CT上的结果一致;(3)根据逻辑回归的结果,通气功能损伤与CT病灶类型相关,纤维化和肺气肿/肺大疱与通气缺陷的相关性最强;(4)混合疾病和肺气肿/肺大疱造成局部通气功能障碍的概率最大,且病灶的位置也会影响肺通气功能.本研究的初步结果有望帮助临床医生结合CT的影像学征象和129Xe MRI综合考虑患者的病情.未来我们将进一步探索病灶位置、大小、形态等因素与肺通气功能之间的具体关系,以期能为肺部疾病患者的个性化治疗方案提供帮助.
利益冲突
无
参考文献
Improved technique for measurement of regional fractional ventilation by hyperpolarized 3He MRI
[J].
Advances in spirometry testing for lung function analysis
[J].
Limitations of airway dimension measurement on images obtained using multi-detector row computed tomography
[J].
Validation of computational fluid dynamics in CT-based airway models with SPECT/CT
[J].
DOI:10.1148/radiol.10100322
PMID:21084417
[本文引用: 1]

To compare the results obtained by using numerical flow simulations with the results of combined single photon emission computed tomography (SPECT) and computed tomography (CT) and to demonstrate the importance of correct boundary conditions for the numerical methods to account for the large amount of interpatient variability in airway geometry.This study was approved by all relevant institutional review boards. All patients gave their signed informed consent. In this study, six patients with mild asthma (three men; three women; overall mean age, 46 years ± 17 [standard deviation]) underwent CT at functional residual capacity and total lung capacity, as well as SPECT/CT. CT data were used for segmentation and computational fluid dynamics (CFD) simulations. A comparison was made between airflow distribution, as derived with (a) SPECT/CT through tracer concentration analysis, (b) CT through lobar expansion measurement, and (c) CFD through flow computer simulation. Also, the heterogeneity of the ventilation was examined.Good agreement was found between SPECT/CT, CT, and CFD in terms of airflow distribution and hot spot detection. The average difference for the internal airflow distribution was less than 3% for CFD and CT versus SPECT/CT. Heterogeneity in ventilation patterns could be detected with SPECT/CT and CFD.This results of this study show that patient-specific computer simulations with appropriate boundary conditions yield information that is similar to that obtained with functional imaging tools, such as SPECT/CT.http://radiology.rsna.org/lookup/suppl/doi:10.1148/radiol.10100322/-/DC1.© RSNA, 2010
Hyperpolarized gas MRI in pulmonology
[J].
Overview and progress of X-nuclei magnetic resonance imaging in biomedical studies
[J].
Study on the automatic accumulation-thawing device of hyperpolarized 129Xe
[J].
超极化129Xe自动收集-升华装置研究
[J].
DOI:10.11938/cjmr20222998
[本文引用: 1]
因其较高的核自旋极化度所提供的探测灵敏度,超极化<sup>129</sup>Xe气体已被成功应用于动物和人体磁共振成像(MRI).但是,在超极化<sup>129</sup>Xe的收集-升华过程中,多种因素会导致<sup>129</sup>Xe核自旋弛豫,进而限制其应用范围.本文通过理论模型分析和实验测量,验证了温度、磁场、螺旋冷阱材质等对冷冻恢复过程中超极化<sup>129</sup>Xe弛豫的影响;同时,测量了自动收集-升华装置的稳定性.研究结果表明,升华方式和冷阱材质对<sup>129</sup>Xe极化度损耗的影响显著;自制收集-升华装置的自动化程度高、长时间稳定,<sup>129</sup>Xe极化度的恢复率可达到85.6% ± 4.7%.本研究非常有助于提升超极化<sup>129</sup>Xe在动物和人体MRI中的使用效率.
Chronic obstructive pulmonary disease: safety and tolerability of hyperpolarized 129Xe MR imaging in healthy volunteers and patients
[J].
Hyperpolarized 129Xe magnetic resonance imaging: tolerability in healthy volunteers and subjects with pulmonary disease
[J].
Asthma control, airway mucus, and 129Xe MRI ventilation after a single benralizumab dose
[J].
Postacute COVID-19 Syndrome: 129Xe MRI Ventilation Defects and Respiratory Outcomes 1 Year Later
[J].
Damaged lung gas exchange function of discharged COVID-19 patients detected by hyperpolarized 129Xe MRI
[J].
Evaluation of injuries caused by coronavirus disease 2019 using multi-nuclei magnetic resonance imaging
[J].
DOI:10.1016/j.mrl.2021.100009
PMID:35673615
[本文引用: 1]
The ongoing pandemic of coronavirus disease 2019 (COVID-19) has been a great burden for the healthcare system in many countries because of its high transmissibility, severity, and fatality. Chest radiography and computed tomography (CT) play a vital role in the diagnosis, detection of complications, and prognostication of COVID-19. Additionally, magnetic resonance imaging (MRI), especially multi-nuclei MRI, is another important imaging technique for disease diagnosis because of its good soft tissue contrast and the ability to conduct structural and functional imaging, which has also been used to evaluate COVID-19-related organ injuries in previous studies. Herein, we briefly reviewed the recent research on multi-nuclei MRI for evaluating injuries caused by COVID-19 and the clinical H MRI techniques and their applications for assessing injuries in lungs, brain, and heart. Moreover, the emerging hyperpolarized Xe gas MRI and its applications in the evaluation of pulmonary structures and functional abnormalities caused by COVID-19 were also reviewed.© 2021 The Authors.
Quantitative analysis of lung function and airway remodeling using ventilation/perfusion single photon emission tomography/computed tomography and HRCT in patients with chronic obstructive pulmonary disease and asthma
[J].
DOI:10.1007/s12149-023-01848-7
PMID:37268867
[本文引用: 1]
To investigate the role of V/P SPECT/CT and HRCT quantitative parameters in evaluating COPD and asthma disease severity, airway obstructivity-grade, ventilation and perfusion distribution patterns, airway remodeling, and lung parenchymal changes.Fifty-three subjects who underwent V/P SPECT/CT, HRCT, and pulmonary function tests (PFTs) were included. Preserved lung ventilation (PLVF), perfusion function (PLPF), airway obstructivity-grade (OG), proportion of anatomical volume, ventilation and perfusion contribution of each lobe, and V/P distribution patterns were evaluated using V/P SPECT/CT. The quantitative parameters of HRCT included CT bronchial and CT pulmonary function parameters. In addition, the correlation and difference of V/P SPECT/CT-, HRCT-, and PFT-related parameters were compared.There was a statistically significant difference between severe asthma and severe-very severe COPD in CT bronchial parameters, like WA, LA and AA, in the lung segment airways (P < 0.05). CT bronchial parameters, like as WT and WA, were statistically significant (p < 0.05) among asthma patients. The EI of severe-very severe COPD was different from that of the disease severity groups in asthma patients (P < 0.05). The airway obstructivity-grade, PLVF and PLPF differed significantly among the severe-very severe COPD and mild-moderate asthma patients (P < 0.05). And the PLPF was statistically significant among the disease severity groups in asthma and COPD (P < 0.05). OG and PLVF, PLPF, and PFT parameters were significantly correlated, with the FEV1 correlation being the most significant (r = - 0.901, r = 0.915, and r = 0.836, respectively; P < 0.01). There was a strong negative correlation between OG and PLVF (r = - 0.945) and OG and PLPF (r = - 0.853) and a strong positive correlation between PLPF and PLVF (r = 0.872). In addition, OG, PLVF, and PLPF were moderately to strongly correlated with CT lung function parameters (r = - 0.673 to - 0.839; P < 0.01), while lowly to moderately correlated with most CT bronchial parameters (r = - 0.366 to - 0.663, P < 0.01). There were three different V/P distribution patterns, including matched, mismatched, and reverse mismatched patterns. Last, the CT volume overestimated the contribution in the upper lobes and underestimated the lower lobes' contribution to overall function.Quantitative assessment of ventilation and perfusion abnormalities and the degree of pulmonary functional loss by V/P SPECT/CT shows promise as an objective measure to assess the severity of disease and lung function to guide localized treatments. There are differences between HRCT parameters and SPECT/CT parameters among the disease severity groups in asthma and COPD, which may enhance, to some extent, the understanding of complex physiological mechanisms in asthma and COPD.© 2023. The Author(s) under exclusive licence to The Japanese Society of Nuclear Medicine.
FDG-PET/CT of COVID-19 and Other Lung Infections
[J].
Chronic obstructive pulmonary disease: lobar analysis with hyperpolarized 129Xe MR imaging
[J].
Is computed tomography airway count related to asthma severity and airway structure and function?
[J].
Evaluation of structure-function relationships in asthma using multidetector CT and hyperpolarized 3He MRI
[J].
Global initiative for chronic obstructive lung disease 2023 report: GOLD executive summary
[J].
Evaluation of asthma with hyperpolarized helium-3 MRI: correlation with clinical severity and spirometry
[J].
DOI:10.1378/chest.130.4.1055
PMID:17035438
[本文引用: 1]
Accurate characterization of asthma severity is difficult due to the variability of symptoms. Hyperpolarized helium-3 MRI (H(3)HeMR) is a new technique in which the airspaces are visualized, depicting regions with airflow obstruction as "ventilation defects." The objective of this study was to compare the extent of H(3)HeMR ventilation defects with measures of asthma severity and spirometry.Patients with a physician diagnosis of asthma and normal control subjects underwent H(3)HeMR. For each person, the number and size of ventilation defects were scored and the average number of ventilation defects per slice (VDS) was calculated. The correlations of the imaging findings with measures of asthma severity and spirometry were determined.There were 58 patients with asthma (mild-intermittent, n = 13; mild-persistent, n = 13; moderate-persistent, n = 20; and severe-persistent, n = 12) and 18 control subjects. Mean +/- SE VDS for asthmatics was significantly greater than for control subjects (0.99 +/- 0.15 vs 0.26 +/- 0.22, p = 0.004). Among asthmatics, VDS was significantly higher for the group with moderate-persistent and severe-persistent disease than for the group with mild-intermittent and mild-persistent disease (1.37 +/- 0.24 vs 0.53 +/- 0.12, p < 0.001). VDS correlated significantly with FEV(1)/FVC (r = - 0.51, p = 0.002), forced expiratory flow between 25% and 75% from the beginning of FVC (FEF(25-75%)) percentage of predicted for height, sex, and race (%predicted) [r = - 0.50, p = 0.001], and FEV(1) %predicted (r = - 0.40, p = 0.002), but not with FVC %predicted (r = - 0.26, p = 0.057) and peak expiratory flow %predicted (r = - 0.16, p = 0.231). Many asthmatics had an elevated VDS, but their spirometric indexes, except FEF(25%-75%), were normal. Most ventilation defects were < 3 cm in size for all asthmatics. In the group of patients with moderate-to-severe persistent asthma, there were more defects > or =3 cm than in the group with mild-intermittent and mild-persistent disease (p = 0.021).Regional changes of airflow obstruction in asthmatics depicted by H(3)HeMR correlate with measures of asthma severity and spirometry.
Quantitative analysis of hyperpolarized 129Xe ventilation imaging in healthy volunteers and subjects with chronic obstructive pulmonary disease
[J].
Comparison of hyperpolarized 3He-MRI, CT based parametric response mapping, and mucus scores in asthmatics
[J].
Characteristics and prognostic factors of pulmonary fibrosis after COVID-19 pneumonia
[J].
Lung nodule pre-diagnosis and insertion path planning for chest CT images
[J].
Imaging in cystic fibrosis and non cystic fibrosis bronchiectasis
[J].
