


引言
随着扩散成像技术发展,除了常规的单指数模型(mono-exponential,Mono),近年来涌现出了一系列新模型,更好地揭示组织的微观结构和量化非高斯性扩散现象.例如,体素内非相干运动模型(intravoxel incoherent motion,IVIM)可以分离组织中的快、慢两种扩散成分,即IVIM_D和IVIM_D*,分别反应灌注和纯扩散信息,以及快扩散的比例系数或灌注分数IVIM_f [5];扩散峰度模型(diffusion kurtosis imaging,DKI)可以进一步揭示并定量化组织的非高斯性扩散现象,获得扩散峰度值DKI_K和校正后的扩散系数DKI_D[6];扩散拉伸指数模型(stretch exponential model,SEM)在不同组织的扩散成分之间引入了一个体素内异质性参数SEM_α,用于描述各扩散成分的分布情况,以及SEM_DDC反应平均扩散系数[7];分数微积分模型(fractional-order calculus model,FROC)是一种基于分数阶微积分理论的扩散模型,其将传统的扩散模型中的整数阶微积分改为分数阶微积分,从而更好地描述扩散现象的复杂性,该模型计算体素内异质性参数FROC_β、平均扩散系数FROC_D以及扩散的微观尺度FROC_μ,已被用于肝脏、脑等多种组织中的扩散研究[8,9];随机游走模型(continuous time random walk model,CTRW)是一种用于描述扩散过程的数学模型,该模型认为弥散是一个离散的、随机的过程,可以用一个随机游走模型来描述,因此CTRW模型可以通过模拟扩散在多种组织中的行为,从而更好地描述其扩散时的非高斯性,该模型分别计算体素内时间和空间异质性参数CTRW_α、CTRW_β,以及平均扩散系数CTRW_D,目前已被应用于脑肿瘤、乳腺癌的研究[10⇓⇓-13].
不同的扩散模型可以反映出不同的组织微观结构,其数据采集方案也有所不同.IVIM模型和DKI模型通常采用不同的b值方案,IVIM模型通常使用低b值(0~200 s/mm²)和高b值(800~1 000 s/mm²)的数据,而DKI模型则在该基础上增加了更高的b值范围(≥2 000 s/mm²)从而更好地描述组织微观结构.相比之下,SEM、FROC和CTRW模型则更关注多种扩散成分的分布情况,因此通常需要使用较大的b值范围建模(例如,0~2 500 s/mm²).这些模型在b值采集方面的差异反映了不同的假设和建模方法,因此需要根据研究问题选择合适的模型和b值范围.
本文旨在评估不同b值采集方案对各扩散模型定量计算的影响,一方面提供扫描方案的参考依据,并尝试推荐效率更高的采集方案,从而推动未来高级扩散模型的联合应用以及多中心研究;另一方面,评估不同模型对采集方案的敏感性,为后续临床研究中扩散模型选择提供参考.
1 实验部分
1.1 临床数据
本研究总共采集了73例前列腺患者MRI数据,其中包含48例前列腺增生病例,25例前列腺癌病例,并收集了其临床数据,包括患者的年龄、临床分期、组织学等级等信息.其中,患者的年龄范围在50~80岁,临床分期为T1至T3a,组织学等级为格利森(Gleason)评分6~9分.临床数据的纳入标准为:(1)患者进行前列腺磁共振检查前均未做过内分泌、放射、化疗或手术治疗,未针对病灶做过穿刺;(2)磁共振检查2个月内经穿刺活检或手术得到病理结果;(3)图像无明显伪影、失真或变形,病灶直径不小于5 mm且与周围背景组织对比清晰.该研究获马鞍山市人民医院伦理委员会批准(2021第006-008号).
1.2 数据采集
MRI数据采集是在西门子3T MAGNETOM Prisma磁共振仪上完成的.扩散数据采用小视野自旋回波-平面回波成像序列,具体扫描参数如下:重复时间(TR)和回波时间(TE)分别为3 500 ms和74 ms,采用b值为0、50、100、200、500、1 000、1 500、2 000和2 500 s/mm²,在三个不同方向上采集,并进行几何平均.层厚为3 mm,体素尺寸为0.9×0.9 mm2,视野为200×109 mm2,总共采集23层,带宽为1 568 Hz/Pixel,总采集时间为6 min 18 s.采用在线动态场校正技术以消除涡流导致的图像变形.
1.3 扩散模型计算
针对每个方案的数据,同时计算Mono、IVIM、DKI、SEM、FROC和CTRW模型的定量参数.使用自主开发的软件BoDiLab进行所有定量参数的计算,该软件基于Python 3.5平台开发,集成了上述6种扩散模型的计算.扩散数据的预处理流程包括以下两个步骤:1)去除背景:基于b = 0的T2加权图,通过设置灰度阈值30去除背景区域;2)图像平滑:基于3D高斯滤波,平滑核sigma = 1.25.模型定量参数计算方面,IVIM使用分段拟合算法,即首先假设在较高b值下灌注成分可以忽略,然后通过线性拟合和较高b值扩散数据计算扩散系数D和灌注分数f,最后将计算得到的D和f参数带入IVIM模型,通过线性拟合计算伪扩散系数D*.这里使用b值200 s/mm²作为IVIM模型的b值分段阈值.Mono使用线性拟合,DKI、SEM、FROC和CTRW模型的计算均采用非线性拟合算法,具体算法可参考BoDiLab相关的前期成果[13,18⇓⇓⇓⇓-23].
1.4 数据分析
本研究回顾性地使用原始多b值扩散数据,模拟了4组不同b值范围的采集方案,并计算了不同b值范围下各扩散模型的定量参数,以比较不同b值范围对各扩散模型的影响.这4组方案选用不同的b值范围(即bmax值不同),分别为0~1 000 s/mm²、0~1 500 s/mm²、0~2 000 s/mm²和0~2 500 s/mm²(其中0~2 500 s/mm²为参考采样方案),在后文中将简要表示为b0~1 000、b0~1 500、b0~2 000和b0~2 500.
针对原始的弥散数据和重建定量参数图,本研究采用感兴趣区(region of interest,ROI)分析,ROI勾画于b值为1 500 s/mm²的图像,包含完整的前列腺增生和前列腺癌病灶区域,由一位具有5年以上临床经验的放射科医师勾画ROI,并由另一位具有5年以上临床经验的医师校验和复核.ROI勾画使用开源多平台应用软件ITK-SNAP(www.itksnap.org).将勾画的ROI拷贝到所有定量参数图,计算ROI内的平均值和方差,并进行比较.
4组不同b值方案下的扩散参数比较,主要包括两方面内容:
(1)ROI数值差异比较:在ROI区域内,计算不同方案下的扩散参数与全b值扩散参数的相关系数和t检验.相关系数高于0.95被判定为相关性较高,t检验p值低于0.05被判定为有显著差异.
(2)临床鉴别效能比较:比较不同方案下的扩散参数在前列腺增生和前列腺癌的鉴别效能,将前列腺癌作为正样本,前列腺增生作为负样本,计算受试者工作特征曲线(receiver operating characteristic,ROC)的曲线下面积(area under the curve,AUC),并通过Delong检验看不同的采集方案有无显著差异,阈值为0.05.
2 结果与讨论
2.1 ROI数值差异比较
本节旨在比较不同b值范围下的扩散参数ROI均值的相关性和差异.图1为不同b值范围计算的多个扩散模型定量参数差异图.
图1

图1
不同b值范围计算的多个扩散模型定量参数差异图,参考图为以b值0 ~2 500 s/mm2计算所得.图中每行显示不同扩散定量参数和bmax值扩散加权图像,每列显示不同b值采集方案的定量参数以及其与参考图像的残差
Fig. 1
Comparisons between quantitative parameters of multiple diffusion models based on different ranges of b-values, with parameters from b-value 0~2 500 s/mm2 serving as the reference image. Each row displays different diffusion quantitative parameters and the diffusion-weighted image with the maximum b-value, while each column displays quantitative parameters from different b-value acquisition schemes and their residuals compared to the reference image
从图1可以观察到,各扩散参数在不同bmax方案之间呈现了不同程度的残差,并且随着bmax值的减小而逐渐增加,其中DKI_K对bmax的响应最为显著.图2为基于不同b值采集范围计算的前列腺增生和癌灶中扩散模型定量参数的ROI均值,从图中可见在所有参数中,Mono_D、DKI_D、DKI_K、IVIM_D、IVIM_f和FROC_D的ROI均值变化相对较大,表明了Mono、DKI、IVIM和FROC模型的定量参数ROI均值受到不同b值范围的影响相对较大.与此相对,SEM和CTRW模型的各扩散参数表现出其ROI均值对不同b值方案的敏感性较低的特点.由于不同扩散参数的取值范围差异较大,图中使用了归一化参数,即以参考采样方案扩散参数对各方案扩散参数数据进行归一化.因此,参考采样方案的所有参数取值均为1.00.
图2
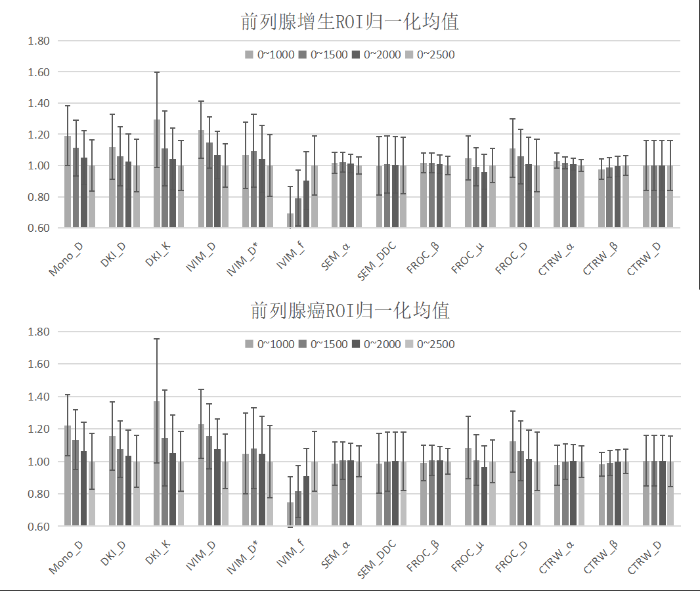
图2
基于不同b值采集范围计算的前列腺增生和癌灶中扩散模型定量参数的ROI均值.扩散模型包括Mono、DKI、IVIM、SEM、FROC和CTRW
Fig. 2
Differences between the diffusion parameters calculated based on different b-value ranges, using ROI mean values in prostate hyperplasia and cancer. The diffusion models include Mono, DKI, IVIM, SEM, FROC, and CTRW models
表1为各b值方案扩散参数的相关性分析结果,由表中数据可见,不同b值方案所得扩散参数与b0~ 2 500扩散参数之间的相关性整体较高,同时随着bmax值的降低,扩散参数的相关性整体下降. 其中b0~2 000和参考采样方案之间所有参数的相关系数不低于0.98. b0~1 500除DKI_D之外的所有参数不低于0.95. b0~1 000相对略低,在所有参数中,CTRW_α、DKI_D、IVIM_D*、IVIM_f的相关系数略低,其中整体最低为CTRW_α参数,其在前列腺增生和前列腺癌组中与参考采样方案之间的相关性系数分别为0.70和0.88. 即便如此,b0~1 000大部分参数的相关系数仍在0.86以上.
表1 各b值方案扩散参数相关性分析
Table 1
| 扩散参数 | 前列腺增生 | 前列腺癌 | |||||
|---|---|---|---|---|---|---|---|
| b0~1000 | b0~1500 | b0~2000 | b0~1000 | b0~1500 | b0~2000 | ||
| Mono_D | 0.97 | 0.99 | 1.00 | 0.98 | 0.99 | 1.00 | |
| DKI_D | 0.93 | 0.98 | 1.00 | 0.77 | 0.94 | 0.99 | |
| DKI_K | 0.90 | 0.97 | 0.99 | 0.93 | 0.95 | 0.99 | |
| IVIM_D | 0.96 | 0.99 | 1.00 | 0.96 | 0.98 | 0.99 | |
| IVIM_D* | 0.86 | 0.96 | 0.98 | 0.91 | 0.95 | 0.99 | |
| IVIM_f | 0.90 | 0.97 | 0.99 | 0.89 | 0.96 | 0.99 | |
| SEM_α | 0.93 | 0.98 | 1.00 | 0.97 | 0.99 | 1.00 | |
| SEM_DDC | 0.99 | 1.00 | 1.00 | 0.96 | 0.99 | 1.00 | |
| FROC_β | 0.97 | 0.99 | 1.00 | 0.89 | 0.96 | 0.99 | |
| FROC_μ | 0.91 | 0.97 | 0.99 | 0.96 | 0.98 | 0.99 | |
| FROC_D | 0.98 | 1.00 | 1.00 | 0.99 | 1.00 | 1.00 | |
| CTRW_α | 0.70 | 0.97 | 0.99 | 0.88 | 0.98 | 1.00 | |
| CTRW_β | 1.00 | 1.00 | 1.00 | 0.99 | 1.00 | 1.00 | |
| CTRW_D | 1.00 | 1.00 | 1.00 | 1.00 | 1.00 | 1.00 | |
表2为各b值方案间扩散系数差异的t检验结果.从表中可见,随着bmax值的降低,越来越多的扩散参数呈现出显著差异(p ≤ 0.05).在b0~2 000组中,只有IVIM模型的部分参数显示出显著差异. 在b0~1 500组中,IVIM的参数差异更为显著,同时Mono和DKI模型的部分参数也呈现出显著差异.在b0~1 000组中,除了上述三个模型的参数差异显著性进一步提升之外,FROC_D和CTRW_α参数也呈现出差异.由此,在扩散模型中Mono、DKI和IVIM模型的大部分参数受到b值范围的影响较显著,特别是IVIM模型,而FROC和CTRW模型的大部分参数受到影响整体相对前述模型较小,只有在bmax值为1 000和1 500 s/mm2时部分参数才呈现出显著差异.而SEM模型受b值范围变化影响最小.
表2 各b值方案间扩散参数差异的t检验p值
Table 2
| 扩散参数 | 前列腺增生 | 前列腺癌 | |||||
|---|---|---|---|---|---|---|---|
| b0~1000 | b0~1500 | b0~2000 | b0~1000 | b0~1500 | b0~2000 | ||
| Mono_D | <0.001 | 0.002 | 0.143 | <0.001 | 0.013 | 0.226 | |
| DKI_D | 0.003 | 0.107 | 0.463 | 0.006 | 0.126 | 0.471 | |
| DKI_K | <0.001 | 0.010 | 0.250 | <0.001 | 0.047 | 0.400 | |
| IVIM_D | <0.001 | <0.001 | 0.031 | <0.001 | 0.006 | 0.157 | |
| IVIM_D* | 0.122 | 0.036 | 0.317 | 0.482 | 0.246 | 0.493 | |
| IVIM_f | <0.001 | <0.001 | 0.013 | <0.001 | 0.001 | 0.078 | |
| SEM_α | 0.170 | 0.090 | 0.300 | 0.680 | 0.846 | 0.792 | |
| SEM_DDC | 0.939 | 0.850 | 0.897 | 0.813 | 0.970 | 0.955 | |
| FROC_β | 0.170 | 0.173 | 0.445 | 0.707 | 0.859 | 0.804 | |
| FROC_μ | 0.065 | 0.73 | 0.081 | 0.084 | 0.847 | 0.356 | |
| FROC_D | 0.003 | 0.110 | 0.764 | 0.026 | 0.230 | 0.813 | |
| CTRW_α | 0.001 | 0.027 | 0.361 | 0.467 | 0.976 | 0.936 | |
| CTRW_β | 0.085 | 0.341 | 0.700 | 0.395 | 0.664 | 0.891 | |
| CTRW_D | 0.993 | 0.993 | 0.993 | 0.951 | 0.951 | 0.951 | |
2.2 临床鉴别效能比较
本节比较了不同b值范围方案下的扩散参数在鉴别前列腺增生和癌灶方面的效能,并计算了各参数的AUC,结果如图3所示.由图3可见,IVIM_f和FROC_μ受采集方案b值范围的影响较大,随着bmax值的降低,IVIM_f和FROC_μ的AUC也逐渐降低,分别由0.75和0.65下降为0.61和0.46.同时DKI_D、DKI_K、IVIM_D*、FROC_β和CTRW_α也受到采集方案中b值范围的小幅影响.意外的是,CTRW_α随着bmax值的下降,AUC有所提升,由0.84升高到0.92,成为所有参数中AUC最大的参数.其他参数的AUC基本不受b值方案的影响.总体而言,Mono、SEM和CTRW模型定量参数受b值范围的影响较小.
图3
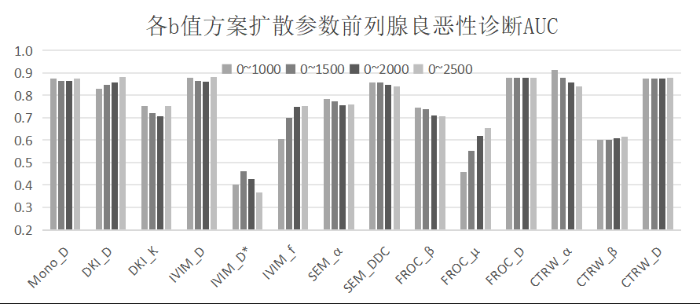
图3
基于不同b值范围的多扩散参数在鉴别前列腺增生与癌灶中的AUC比较
Fig. 3
The AUC of quantitative parameters of multiple diffusion models based on different b-value ranges in distinguishing prostate hyperplasia and cancer
在前列腺增生和癌灶的鉴别效能方面,所有模型的扩散系数参数(Mono_D、IVIM_D、SEM_DDC、FROC_D、CTRW_D)均呈现出高AUC(不低于0.83),其中FROC_D和CTRW_D稳定性最高,AUC的变化小于0.01.
2.3 讨论
近年来,越来越多的体部扩散模型被应用于临床,然而,这些模型的参数计算受到b值采集方案的影响,目前尚未有全面的评估.因此,本文旨在研究不同b值采集范围对Mono、DKI、IVIM、SEM、FROC和CTRW这6种扩散模型定量参数计算的影响.通过模型参数之间的相关性、t检验以及前列腺增生和癌灶鉴别效能3个维度评估,试图确定适用于大部分扩散模型的推荐b值采集方案,并评估不同模型对b值方案的鲁棒性.
不同b值范围对各模型参数的均值存在一定影响,其对Mono、IVIM、DKI和FROC模型的影响大于SEM和CTRW模型.特别是在b0~1 500方案中,IVIM模型的多个参数间存在显著差异.然而,不同b值范围对各参数之间的相关性影响较小,当bmax值在1 500 s/mm2及以上时,各模型参数之间的相关性均高于0.94.同时,前列腺增生和癌灶的鉴别结果受不同b值范围的影响也较小.这一发现表明,扩散模型参数的均值受b值范围影响会产生系统性偏差,但该偏差并不会显著影响组织之间的定量参数差异,从而对诊断效能影响较小.
不同b值范围组与参考采样组之间的相关性分析结果表明,bmax值在1 500 s/mm2及以上时,除DKI_D之外的其他模型参数与b0~2 500方案的相关性均较高,前列腺癌诊断效能接近,而DKI_D的相关系数虽略低于其他参数,也达到了0.94.因此,b0~1 500和b0~2 000的采集方案也可用于多个扩散模型的临床应用中.在之前的工作中[15],高级模型如DKI、SEM、FROC和CTRW均要求使用较高b值,例如DKI要求使用bmax值不低于2 000 s/mm2,而FROC和CTRW模型在之前的神经应用中则使用了更高的b值.
然而,与神经应用不同,体部组织的T2弛豫时间较短,因此高b值将导致较低的图像信噪比,使得扩散数据的质量下降或采集时间增加,这将限制多b值扩散模型体部的应用.本文发现,b值范围对各模型参数计算产生的系统误差对组织鉴别影响较小,因此在实际临床应用中,可使用较小的bmax值.因此,为平衡采集时间和诊断效能,本文推荐bmax值为1 500 s/mm2,可显著提升数据采集效率,将采集时间从6 min 18 s降低为3 min 9 s,时间缩短50%.而即使将bmax值设为2 000 s/mm2,采集时间也可以缩短至4 min 33 s.虽然将bmax值进一步降为1 000 s/mm2时采集时间还可以进一步缩短,但部分模型参数如IVIM_f、FROC_μ以及DKI_D的诊断效能逐渐降低,所以在实际应用中不推荐.
在以往的研究中DKI、SEM、FROC和CTRW模型通常需要bmax值不小于2 000 s/mm2 [15],而根据前列腺影像报告和数据系统(Prostate Imaging Reporting and Data System,PI-RADS),其临床扩散数据b值范围选择会考虑前文提到的信噪比原因,bmax值通常设置在1 500 s/mm2以下,因此将导致大量临床扩散数据无法进行这些扩散模型的分析.本文实验分析证明0~1 500 s/mm2的扩散数据也可以获得0~2 500 s/mm2数据高度一致的模型计算结果和诊断效能,这将使更多的临床数据可以满足回顾性研究的要求,从而充分挖掘扩散模型的价值,并有望获得更高的临床诊断效能.
此外,不同扩散模型对于b值方案的敏感性存在差异,正如上文中所述SEM模型的总体受影响程度小于其他模型.相比之下,DKI模型反映了扩散非高斯性,随着bmax值的增加,非高斯效应更加明显,因此其定量受b值影响更大.IVIM模型将扩散分为快和慢两个成分,慢成分的扩散系数IVIM_D的计算受b值范围的影响,同时也会间接影响快慢成分的比例即IVIM_f的计算,因此该模型参数对b值相对较敏感.SEM、FROC和CTRW都是反映体素内异质性的扩散模型,其中SEM和CTRW模型参数受b值范围影响的程度略小于FROC,这得益于扩散模型本身的计算稳定性.而与它们相比,FROC模型为了获得更稳定的拟合结果,在其计算过程中需要先基于常规单指数模型获得FROC_D值,因此模型参数对于b值的范围也比较敏感.总体来说,Mono、SEM和CTRW受b值范围影响小于IVIM、DKI和FROC模型.
一个有趣的发现是大部分扩散参数随着bmax的降低,前列腺良恶性诊断效能也随之降低,或者呈随机变化,但CTRW_α参数随着bmax值的下降,AUC反呈上升趋势,由0.84升高到0.92,基于b0~1 000的CTRW_α具有所有参数中最高的AUC. 我们认为这可能与前列腺多个扩散成分在不同b值范围中其信号强度有关. 在低b值范围中,扩散信号来源于灌注伪随机扩散、细胞外和细胞内扩散三个成分,产生信号异质性较大,而随着b值范围增加,这前两种成分均完全衰减,取而代之的是细胞内扩散单成分,因此扩散的异质性随之降低.
本文首次针对Mono、IVIM、DKI、SEM、FROC和CTRW 6个扩散模型同时分析b值范围对其定量参数计算的影响.结果表明,对于所有模型,bmax值采集范围在1 500~2 500 s/mm2之间时,各模型参数的相关性和诊断效能接近.因此,在不影响诊断结果的情况下,通过优化b值采集范围可以大幅降低数据采集时间.同时,不同扩散模型受b值采集方案的影响也不同.其中,SEM和CTRW模型的定量参数对b值范围的依赖较其他模型更小.近年的研究表明,扩散多模型联合应用具有广阔的应用前景.本文通过系统性的研究b值采集方案对多种扩散模型定量的影响,对于未来多扩散模型的前列腺应用将具有以下实际意义:(1)为后续相关工作在扩散数据采集的b值范围选择上提供了参考依据;(2)显著加快了数据采集速度,使得多b值扩散模型可以在3 min左右完成扫描,将推动该技术的临床实用;(3)使新的扩散模型可应用于常规扩散数据,这意味着可以回顾性分析前列腺大样本数据库,进一步挖掘数据潜在价值.此外,本文结论是否也适用于其他部位也具有较大实用价值,有待进一步探索.
本文也存在一定的局限性,主要表现为:(1)实验中样本量有限,但本文主旨是比较不同b值范围对多个模型参数的影响,因此在多个b值方案间的比较中样本为前列腺癌与增生病例总和的73例数据,较为合理,而在前列腺癌与增生鉴别诊断效能评估中样本量较有限,但多个b值方案的诊断效能变化趋势明显(见图3),因此我们认为该实验结果可以支持本文结论;(2)由于扩散采集时间较长,本研究中仅利用了单个数据进行了不同b值方案的模型定量参数计算,而未进行不同b值方案的直接采集;(3)实验中ROI的勾画仅由一位医师完成,但勾画结果通过另一位高年资医师复核,且本文主旨是比较不同b值方案之间的差异,因此ROI勾画个体差异对本文结论影响较小.
3 结论
本文研究了不同b值采集范围对6种扩散模型定量参数计算的影响,并试图确定适用于大部分扩散模型的推荐b值采集方案.实验结果显示,b值范围对模型参数的均值存在一定影响,但对各参数之间的相关性影响较小,且对前列腺癌良恶性鉴别效能影响也较小.bmax值在1 500 s/mm2及以上时,除IVIM外的其他模型参数之间的相关性均较高,前列腺癌诊断效能接近,因此均可在临床研究中应用,而考虑到进一步降低数据采集时间从而便于未来扩散模型的推广,本文推荐使用bmax值为1 500 s/mm2.同时,不同扩散模型定量参数对于b值方案的敏感性存在差异,其中SEM和CTRW模型的定量参数对扩散b值范围的依赖较其他模型更小,在研究中推荐使用.此外,由于0~1 500 s/mm2为常规前列腺扩散数据采集范围,因此本文中的扩散模型均可应用于更多临床数据,如有望用于开展回顾性分析前列腺大样本数据库,进一步挖掘数据潜在价值.
致谢
感谢安徽省重点研究与开发计划项目(2022e07020065)、皖南医学院教学医院科研项目(JXYY202128)以及上海高校教师产学研见习计划对本研究的支持.
利益冲突
无
参考文献
MR diffusion tensor spectroscopy and imaging
[J].
DOI:10.1016/S0006-3495(94)80775-1
PMID:8130344
[本文引用: 1]

This paper describes a new NMR imaging modality--MR diffusion tensor imaging. It consists of estimating an effective diffusion tensor, Deff, within a voxel, and then displaying useful quantities derived from it. We show how the phenomenon of anisotropic diffusion of water (or metabolites) in anisotropic tissues, measured noninvasively by these NMR methods, is exploited to determine fiber tract orientation and mean particle displacements. Once Deff is estimated from a series of NMR pulsed-gradient, spin-echo experiments, a tissue's three orthotropic axes can be determined. They coincide with the eigenvectors of Deff, while the effective diffusivities along these orthotropic directions are the eigenvalues of Deff. Diffusion ellipsoids, constructed in each voxel from Deff, depict both these orthotropic axes and the mean diffusion distances in these directions. Moreover, the three scalar invariants of Deff, which are independent of the tissue's orientation in the laboratory frame of reference, reveal useful information about molecular mobility reflective of local microstructure and anatomy. Inherently tensors (like Deff) describing transport processes in anisotropic media contain new information within a macroscopic voxel that scalars (such as the apparent diffusivity, proton density, T1, and T2) do not.
Diffusion MRI in the brain - theory and concepts
[J].
Imaging brain microstructure with diffusion MRI: practicality and applications
[J].DOI:10.1002/nbm.v32.4 URL [本文引用: 1]
Principles and applications of diffusion-weighted imaging in cancer detection, staging, and treatment follow-up
[J].
DOI:10.1148/rg.316115515
PMID:21997994
[本文引用: 1]
Diffusion-weighted imaging relies on the detection of the random microscopic motion of free water molecules known as Brownian movement. With the development of new magnetic resonance (MR) imaging technologies and stronger diffusion gradients, recent applications of diffusion-weighted imaging in whole-body imaging have attracted considerable attention, especially in the field of oncology. Diffusion-weighted imaging is being established as a pivotal aspect of MR imaging in the evaluation of specific organs, including the breast, liver, kidney, and those in the pelvis. When used in conjunction with apparent diffusion coefficient mapping, diffusion-weighted imaging provides information about the functional environment of water in tissues, thereby augmenting the morphologic information provided by conventional MR imaging. Detected changes include shifts of water from extracellular to intracellular spaces, restriction of cellular membrane permeability, increased cellular density, and disruption of cellular membrane depolarization. These findings are commonly associated with malignancies; therefore, diffusion-weighted imaging has many applications in oncologic imaging and can aid in tumor detection and characterization and in the prediction and assessment of response to therapy.© RSNA, 2011.
Separation of diffusion and perfusion in intravoxel incoherent motion MR imaging
[J].
DOI:10.1148/radiology.168.2.3393671
PMID:3393671
[本文引用: 1]
Intravoxel incoherent motion (IVIM) imaging is a method the authors developed to visualize microscopic motions of water. In biologic tissues, these motions include molecular diffusion and microcirculation of blood in the capillary network. IVIM images are quantified by an apparent diffusion coefficient (ADC), which integrates the effects of both diffusion and perfusion. The aim of this work was to demonstrate how much perfusion contributes to the ADC and to present a method for obtaining separate images of diffusion and perfusion. Images were obtained at 0.5 T with high-resolution multisection sequences and without the use of contrast material. Results in a phantom made of resin microspheres demonstrated the ability of the method to separately evaluate diffusion and perfusion. The method was then applied in patients with brain and bone tumors and brain ischemia. Clinical results showed significant promise of the method for tissue characterization by perfusion patterns and for functional studies in the evaluation of the microcirculation in physiologic and pathologic conditions, as, for instance, in brain ischemia.
Diffusional kurtosis imaging: the quantification of non-gaussian water diffusion by means of magnetic resonance imaging
[J].
DOI:10.1002/mrm.20508
PMID:15906300
[本文引用: 1]
A magnetic resonance imaging method is presented for quantifying the degree to which water diffusion in biologic tissues is non-Gaussian. Since tissue structure is responsible for the deviation of water diffusion from the Gaussian behavior typically observed in homogeneous solutions, this method provides a specific measure of tissue structure, such as cellular compartments and membranes. The method is an extension of conventional diffusion-weighted imaging that requires the use of somewhat higher b values and a modified image postprocessing procedure. In addition to the diffusion coefficient, the method provides an estimate for the excess kurtosis of the diffusion displacement probability distribution, which is a dimensionless metric of the departure from a Gaussian form. From the study of six healthy adult subjects, the excess diffusional kurtosis is found to be significantly higher in white matter than in gray matter, reflecting the structural differences between these two types of cerebral tissues. Diffusional kurtosis imaging is related to q-space imaging methods, but is less demanding in terms of imaging time, hardware requirements, and postprocessing effort. It may be useful for assessing tissue structure abnormalities associated with a variety of neuropathologies.
Characterization of continuously distributed cortical water diffusion rates with a stretched-exponential model
[J].
DOI:10.1002/mrm.10581
PMID:14523958
[本文引用: 1]
Experience with diffusion-weighted imaging (DWI) shows that signal attenuation is consistent with a multicompartmental theory of water diffusion in the brain. The source of this so-called nonexponential behavior is a topic of debate, because the cerebral cortex contains considerable microscopic heterogeneity and is therefore difficult to model. To account for this heterogeneity and understand its implications for current models of diffusion, a stretched-exponential function was developed to describe diffusion-related signal decay as a continuous distribution of sources decaying at different rates, with no assumptions made about the number of participating sources. DWI experiments were performed using a spin-echo diffusion-weighted pulse sequence with b-values of 500-6500 s/mm(2) in six rats. Signal attenuation curves were fit to a stretched-exponential function, and 20% of the voxels were better fit to the stretched-exponential model than to a biexponential model, even though the latter model had one more adjustable parameter. Based on the calculated intravoxel heterogeneity measure, the cerebral cortex contains considerable heterogeneity in diffusion. The use of a distributed diffusion coefficient (DDC) is suggested to measure mean intravoxel diffusion rates in the presence of such heterogeneity.Copyright 2003 Wiley-Liss, Inc.
Preoperative assessment of microvascular invasion of hepatocellular carcinoma using non-Gaussian diffusion-weighted imaging with a fractional order calculus model: A pilot study
[J].DOI:10.1016/j.mri.2021.09.003 URL [本文引用: 1]
Differentiation of low- and high-grade pediatric brain tumors with high b-value diffusion-weighted MR imaging and a fractional order calculus model
[J].DOI:10.1148/radiol.2015142156 URL [本文引用: 1]
The random walk’s guide to anomalous diffusion: a fractional dynamics approach
[J].DOI:10.1016/S0370-1573(00)00070-3 URL [本文引用: 1]
Differentiating low- and high-grade pediatric brain tumors using a continuous-time random-walk diffusion model at high b-values
[J].DOI:10.1002/mrm.v76.4 URL [本文引用: 1]
Quartile histogram assessment of glioma malignancy using high b-value diffusion MRI with a continuous-time random-walk model
[J].DOI:10.1002/nbm.v34.4 URL [本文引用: 1]
Assessment of prognostic factors and molecular subtypes of breast cancer with a continuous-time random-walk mr diffusion model: Using whole tumor histogram analysis
[J].DOI:10.1002/jmri.v58.1 URL [本文引用: 2]
Diffusion-weighted MRI of the abdomen: current value in clinical routine
[J].DOI:10.1002/jmri.v37.1 URL [本文引用: 1]
Diffusion MRI of cancer: From low to high b-values
[J].DOI:10.1002/jmri.v49.1 URL [本文引用: 4]
Whole-tumor histogram analysis of multiple diffusion metrics for glioma genotyping
[J].DOI:10.1148/radiol.210820 URL [本文引用: 2]
Liver fibrosis: stretched exponential model outperforms mono-exponential and bi-exponential models of diffusion-weighted MRI
[J].
DOI:10.1007/s00330-017-5292-z
PMID:29404771
[本文引用: 1]
To compare the ability of diffusion-weighted imaging (DWI) parameters acquired from three different models for the diagnosis of hepatic fibrosis (HF).Ninety-five patients underwent DWI using nine b values at 3 T magnetic resonance. The hepatic apparent diffusion coefficient (ADC) from a mono-exponential model, the true diffusion coefficient (D ), pseudo-diffusion coefficient (D ) and perfusion fraction (f) from a biexponential model, and the distributed diffusion coefficient (DDC) and intravoxel heterogeneity index (α) from a stretched exponential model were compared with the pathological HF stage. For the stretched exponential model, parameters were also obtained using a dataset of six b values (DDC, α). The diagnostic performances of the parameters for HF staging were evaluated with Obuchowski measures and receiver operating characteristics (ROC) analysis. The measurement variability of DWI parameters was evaluated using the coefficient of variation (CoV).Diagnostic accuracy for HF staging was highest for DDC (Obuchowski measures, 0.770 ± 0.03), and it was significantly higher than that of ADC (0.597 ± 0.05, p < 0.001), D (0.575 ± 0.05, p < 0.001) and f (0.669 ± 0.04, p = 0.035). The parameters from stretched exponential DWI and D showed higher areas under the ROC curve (AUCs) for determining significant fibrosis (≥F2) and cirrhosis (F = 4) than other parameters. However, D showed significantly higher measurement variability (CoV, 74.6%) than DDC (16.1%, p < 0.001) and α (15.1%, p < 0.001).Stretched exponential DWI is a promising method for HF staging with good diagnostic performance and fewer b-value acquisitions, allowing shorter acquisition time.• Stretched exponential DWI provides a precise and accurate model for HF staging. • Stretched exponential DWI parameters are more reliable than D from bi-exponential DWI model • Acquisition of six b values is sufficient to obtain accurate DDC and α.
Characterizing sensorimotor-related area abnormalities in amyotrophic lateral sclerosis: an intravoxel incoherent motion magnetic resonance imaging study
[J].
Evaluation of intratumoral heterogeneity by using diffusion kurtosis imaging and stretched exponential diffusion-weighted imaging in an orthotopic hepatocellular carcinoma xenograft model
[J].DOI:10.21037/qims URL [本文引用: 1]
Breast cancer: diffusion kurtosis MR imaging-diagnostic accuracy and correlation with clinical-pathologic factors
[J].
DOI:10.1148/radiol.15141625
PMID:25938679
[本文引用: 1]
To assess diagnostic accuracy with diffusion kurtosis imaging (DKI) in patients with breast lesions and to evaluate the potential association between DKI-derived parameters and breast cancer clinical-pathologic factors.Institutional review board approval and written informed consent were obtained. Data from 97 patients (mean age ± standard deviation, 45.7 years ± 13.1; range, 19-70 years) with 98 lesions (57 malignant and 41 benign) who were treated between January 2014 and April 2014 were retrospectively analyzed. DKI (with b values of 0-2800 sec/mm(2)) and conventional diffusion-weighted imaging data were acquired. Kurtosis and diffusion coefficients from DKI and apparent diffusion coefficients from diffusion-weighted imaging were measured by two radiologists. Student t test, Wilcoxon signed-rank test, Jonckheere-Terpstra test, receiver operating characteristic curves, and Spearman correlation were used for statistical analysis.Kurtosis coefficients were significantly higher in the malignant lesions than in the benign lesions (1.05 ± 0.22 vs 0.65 ± 0.11, respectively; P <.0001). Diffusivity and apparent diffusion coefficients in the malignant lesions were significantly lower than those in the benign lesions (1.13 ± 0.27 vs 1.97 ± 0.33 and 1.02 ± 0.18 vs 1.48 ± 0.33, respectively; P <.0001). Significantly higher specificity for differentiation of malignant from benign lesions was shown with the use of kurtosis and diffusivity coefficients than with the use of apparent diffusion coefficients (83% [34 of 41] and 83% [34 of 41] vs 76% [31 of 41], respectively; P <.0001) with equal sensitivity (95% [54 of 57]). In patients with invasive breast cancer, kurtosis was positively correlated with tumor histologic grade (r = 0.75) and expression of the Ki-67 protein (r = 0.55). Diffusivity was negatively correlated with tumor histologic grades (r = -0.44) and Ki-67 expression (r = -0.46).DKI showed higher specificity than did conventional diffusion-weighted imaging for assessment of benign and malignant breast lesions. Patients with grade 3 breast cancer or tumors with high expression of Ki-67 were associated with higher kurtosis and lower diffusivity coefficients; however, this association must be confirmed in prospective studies.(©) RSNA, 2015 Online supplemental material is available for this article.
Assessment of microvascular invasion of hepatocellular carcinoma with diffusion kurtosis imaging
[J].DOI:10.1148/radiol.2017170515 URL [本文引用: 1]
Multi-model analysis of diffusion-weighted imaging of normal testes at 3.0 T: preliminary findings
[J].
DOI:S1076-6332(17)30482-8
PMID:29331362
[本文引用: 1]
This study aimed to establish diffusion quantitative parameters (apparent diffusion coefficient [ADC], DDC, α, D, and K) in normal testes at 3.0 T.Sixty-four healthy volunteers in two age groups (A: 10-39 years; B: ≥ 40 years) underwent diffusion-weighted imaging scanning at 3.0 T. ADC, ADC, ADC, DDC, α, D, and K were calculated using the mono-exponential, stretched-exponential, and kurtosis models. The correlations between parameters and the age were analyzed. The parameters were compared between the age groups and between the right and the left testes.The average ADC, ADC, ADC, DDC, α, D, and K values did not significantly differ between the right and the left testes (P > .05 for all). The following significant correlations were found: positive correlations between age and testicular ADC, ADC, ADC, DDC, and D (r = 0.516, 0.518, 0.518, 0.521, and 0.516, respectively; P < .01 for all) and negative correlations between age and testicular α and K (r = -0.363, -0.427, respectively; P < .01 for both). Compared to group B, in group A, ADC, ADC, ADC, DDC, and D were significantly lower (P < .05 for all), but α and K were significantly higher (P < .05 for both).Our study demonstrated the applicability of the testicular mono-exponential, stretched-exponential, and kurtosis models. Our results can help establish a baseline for the normal testicular parameters in these diffusion models. The contralateral normal testis can serve as a suitable reference for evaluating the abnormalities of the other side. The effect of age on these parameters requires further attention.Copyright © 2018 The Association of University Radiologists. Published by Elsevier Inc. All rights reserved.
