


引言
随着腹部横断面成像的普及,胰腺囊性肿瘤(PCN)的检出率也呈逐年上升的趋势.中国胰腺囊性肿瘤诊断指南中指出,51.1%的患者缺乏典型的胰腺疾病相关症状[1],这就为疾病的早期诊疗带来了困难.而且,部分PCN具有恶变的风险,其中,胰腺浆液性囊性肿瘤(SCN)一般为良性,胰腺黏液性囊性肿瘤(MCN)具有恶变潜能,二者的术前精确诊断对于制定个性化评估方案具有重要意义.据2023年癌症统计数据报道,胰腺癌的死亡率是最高的.MCN和SCN的精确分类,对于胰腺良恶性肿瘤的早期诊疗具有重要的临床意义,同时为良性患者避免不必要的手术切除.
近年来,基于深度学习和影像组学的方法是研究PCN良恶性的热点[4].最近的研究发现,深度学习和影像组学对胰腺肿瘤的个体化评估有很大贡献,如肿瘤检测、分类以及良恶性判别等[5⇓⇓⇓⇓-10].Zhang等[11]开发并验证了基于卷积神经网络(CNN)的迁移学习模型,该模型使用两个独立的可切除胰腺导管腺癌(PDAC)队列来预测PDAC患者的总体生存.Nguon等[9]使用残差网络(ResNet50)实现了一个区分MCN和SCN的CNN模型.当训练选定的层时,使用预训练的迁移学习模型进行微调训练.该网络模型的准确率为0.827 5,曲线下面积(AUC)得分为0.88.尽管这些发现证实了深度学习和影像组学用于评估PCN的可行性[7,12],但由于大多数研究中包含的数据集较少,且研究的方法较为单一,使得影像组学模型的适用性可能受到限制.因此,胰腺囊性病变需要积累更多的研究数据.
以往的研究大多是单独使用影像组学的方法,或者单独使用深度学习的方法,对MCN和SCN进行分类,虽然都展现出了较好的分类能力,但二者之间是否存在互补的关系还有待研究.本研究旨在构建基于深度学习的多源图像特征分类模型,以区分MCN和SCN,对患者进行个体化评估.
1 实验部分
1.1 一般资料
本研究使用的数据集来自长海医院在2011年至2021年期间接收的172例PCN患者,其中包含65个MCN病例以及107个SCN病例,所有患者均提供书面知情同意书.经病理学证实的107例SCN患者有男性45例,女性62例,平均年龄(48.7±15.1)岁,65例MCN患者中有男性23例,女性42例,平均年龄为(51.9±12.5)岁.
1.2 MRI扫描
所有患者均使用3.0 T系统(Signa Excite 3.0T, GE Healthcare, Milwaukee, USA)进行MRI检查.所有患者仰卧位,相控阵接收器线圈覆盖上腹部,屏气单次快速自旋回波轴位T2加权序列(TR/TE = 6 316/87 ms;视野= 360 × 420 mm2;矩阵= 224 × 270;层厚= 5 mm;层间距= 1 mm).
评估所有PCN的MRI临床特征:(A)肿瘤的位置(胰头、胰体和胰尾);(B)大小(感兴趣区(ROI)的像素体积);(C)患者性别;(D)患者年龄(连续变量),将这些临床特征作为初步的诊断依据.
1.3 基于深度学习的多源特征分类方法
在MCN和SCN的分类模型当中,使用深度学习特征联合影像组学特征集构建RAD_DL多源特征模型,使用添加了临床特征的RAD_DL特征集构建Clinical_RAD_DL多源特征模型.为了探究多源特征分类模型的效能,还使用深度学习特征和传统影像组学特征构建DL特征模型和RAD特征模型.此外,还分别使用SVM、ADAboost、Random Forest和Logistic分类器来训练4种特征模型,使用准确度、召回率、精确率、AUC和F1值等指标评估4种特征模型的分类效能.本研究的流程图如图1所示.
图1
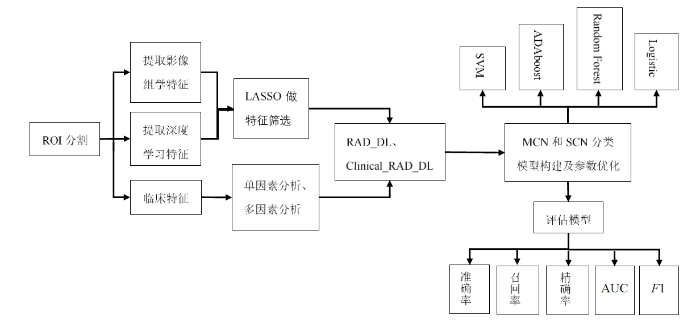
图1
基于深度学习的多源特征模型建模流程
Fig. 1
Experimental workflow of multi-source feature model based on deep learning
1.3.1 图像分割
图2
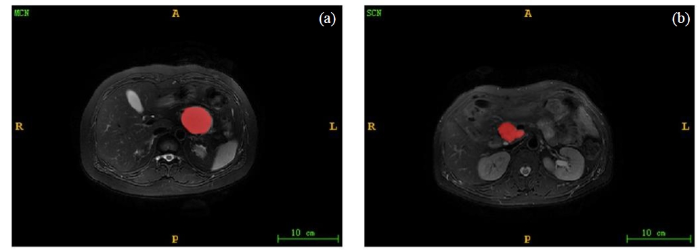
图2
MCN和SCN的分割图像. (a)腹腔轴位T2WI显示MCN呈高信号,其边界规则;(b)腹腔轴位T2WI显示SCN呈高信号,其边界不规则
Fig. 2
Segmentation images of MCN and SCN. (a) Abdominal axial T2WI showed high MCN signal with regular boundary. (b) Abdominal axial T2WI showed high SCN signal with irregular boundary
1.3.2 深度学习特征及影像组学特征提取
本研究基于ResNet50网络来提取深度学习特征,采用python软件包TensorFlow(版本2.1.0)的keras(版本2.3.1)下的ResNet50构建CNN网络.ResNet50由残差模块(residual module)组成总共有50层,残差模块包括3个卷积层,其中包括标准的卷积层、批量归一化层和激活层,可以实现对输入特征映射的高速和高质量转换,通过避免较浅层特征的丢失,可以更好的提取图像对深层特征[13],其主要思想是通过残差连接来解决网络过深而出现的梯度消失问题[14].胰腺在图像中没有固定的形态,结构极为复杂,ResNet50网络因其深度、高度分层和卷积模块的设计,在提取PCN的深度学习特征时,有着明显的优势.ResNet50的网络结构如图2所示.在预训练中加入迁移学习,减少模型过拟合.对该网络随机初始化各层的参数,学习率为0.000 1,衰减率为0.000 1,批数据大小为20,动量为0.9,训练了1 000个循环.
图2
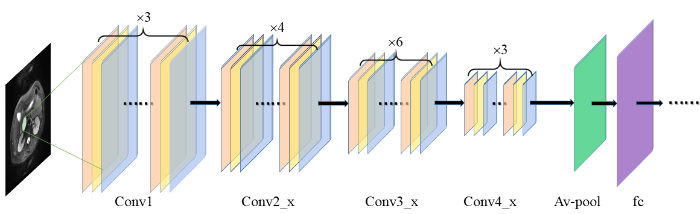
图2
ResNet50提取深度学习特征过程,图中包含4个卷积块(Conv)、平均池化层(Av-pool)以及全连接层(fc)
Fig. 2
The process of ResNet50 extracting deep learning features, which includes four convolution blocks (Conv), average pooling layer (Av-pool) and fully connected layer (fc)
影像组学特征类型包括20个形状(Shape)特征、18个一阶(First order)特征、24个灰度共生矩阵(gray level co-occurrence matrix,GLCM)、14个灰度相关矩阵(gray level dependence matrix,GLDM)、16个灰度游程矩阵(gray level run length matrix,GLRLM)、16个灰度区域大小矩阵(gray level size zone matrix,GLSZM)和5个邻域灰度差矩阵(neighborhood gray tone difference matrix,NGTDM)共7类特征以及小波变换特征.使用3D-slicer软件中的pyradiomics插件对ROI提取影像组学特征,软件提取的特征包含113个原始图像纹理特征和744个小波变换特征共857个特征.
1.3.3 标准化及特征筛选
使用SPSS25.0软件对临床资料做单因素逻辑回归分析和多因素逻辑回归分析,将临床资料中既符合单因素逻辑回归分析又符合多因素逻辑回归分析的特征纳入到后续处理.利用python3.9将影像组学特征及深度学习特征分别进行标准化处理[12],应用LASSO对影像组学特征和深度学习特征分别进行筛选,10折交叉验证的方法用来寻找训练集中最优的拟合参数λ(λ表示L1正则化的惩罚力度).LASSO的主要原则是通过最小化正则化之后的损失函数,实现对回归系数的稀疏化,保留对目标变量的预测具有显著影响的特征.LASSO的损失函数如(1)式所示:
其中,n表示样本数,X表示样本目标向量,w表示L1正则化,y表示样本特征矩阵.(1)式右边的第1项是LASSO的均方误差(mean square error,MSE),第2项是添加了L1正则化的惩罚因子,通过调整λ值,控制L1正则化程度,使LASSO模型的MSE最小化以确定最佳的系数估计,保留对结果影响较大的特征,
其余系数衰减为0.
1.3.4 基于深度学习的多源特征模型构建与评估
使用pycharm2018软件构建分类模型并对模型进行评估.将患者按照约7:3划分为训练集(n=120)和测试集(n=52),将筛选获得的数据集构建RAD、DL、RAD_DL以及Clinical_RAD_DL特征模型.使用SVM、ADAboost、Random Forest以及Logistic Regression分类器进行分类,采用网格搜索和控制变量结合的方法优化各分类器的参数,使用准确率(Accuracy)、召回率(Recall)、精确率(Precision)以及F1值来评价模型的分类效能,最后绘制受试者工作曲线(receiver operating characteristic,ROC)曲线,计算AUC值,利用Delong检验来分析不同模型的ROC曲线间的差异(p<0.05认为差异有统计学意义),最后建立校准曲线和决策曲线进一步评估模型的拟合效果和临床应用价值.
准确率是模型正确分类样本数占总样本数的比例,计算公式如下:
召回率指正确分类的正样本数占实际为正样本数的比例,计算公式如下:
精确率指正确分类的正样本数占预测为正样本数的比例,计算公式如下:
F1值综合考虑了精确率和召回率,是评价分类器性能的综合指标,计算公式如下:
其中(2)~(4)式中TP、FP、TN和FN分别表示真阳性、假阳性、真阴性与假阴性.
单因素逻辑回归分析是用来衡量单个临床特征和分类变量之间的差异,多因素逻辑回归分析是用来衡量多个因素和分类变量之间的差异,评价临床特征的p值和比值比(odds ratio,OR值).当p值小于0.05,表示特征和变量之间有显著性差异;p值大于0.05,则表示特征和变量之间没有显著性差异,不具有统计学意义.当OR值大于1,表示特征和变量之间存在正相关性,该特征是危险因素;OR值等于1,表示特征和变量之间不相关;OR值小于1,表示特征和变量之间存在负相关性,该特征是安全因素.
2 结果与讨论
2.1 SCN和MCN分类结果
2.1.1 基于单(多)因素逻辑回归分析的临床特征筛选
对所有临床特征进行单因素逻辑回归分析以及多因素逻辑回归分析,临床特征对分类变量的相关性分析,单因素逻辑回归分析显示年龄特征(p>0.05)不具有统计学意义,肿瘤的体积大小(OR=1)不是PCN分类的危险因素,位置特征(p<0.05,OR=2.22,95%置信区间(95%CI)= [1.47,3.34])以及性别特征(p<0.05,OR=6.30,95%CI=[1.82,21.82])是PCN分类的危险因素,肿瘤位置特征OR值为2.22,即在胰头比在胰体上PCN分化成MCN的概率提升2.22倍,肿瘤位置在胰体比在胰尾上PCN分化成MCN的概率提升2.22倍,女性患有MCN是男性患有MCN的6.30倍.单因素逻辑回归分析的结果列于表1.
表1 MCN和SCN的临床特征单因素逻辑回归分析
Table 1
| 特征名称 | p值 | OR值 | 95%CI | |
|---|---|---|---|---|
| 下限 | 上限 | |||
| 位置(胰头/胰体/胰尾) | <0.05 | 2.22 | 1.47 | 3.34 |
| 性别(男/女) | <0.05 | 6.30 | 1.82 | 21.82 |
| 年龄 | 0.14 | 0.98 | 0.96 | 1.01 |
| 肿瘤体积 | <0.05 | 1.00 | 1.00 | 1.00 |
将位置特征和性别特征纳入到多因素逻辑回归分析,多因素逻辑回归分析显示位置特征(p<0.05,OR=2.12,95%CI=[1.39,3.24])和性别特征(p<0.05,OR=5.58,95%CI=[1.57,19.84])是PCN分类的危险因子,结果表明,肿瘤位置在胰头比在胰体上PCN分化成MCN的概率提升2.12倍,肿瘤位置在胰体比在胰尾上PCN分化成MCN的概率提升2.12倍,女性患有MCN是男性患有MCN的5.58倍.多因素逻辑回归分析的结果列于表2当中.
表2 MCN和SCN的临床特征多因素逻辑回归分析
Table 2
| 特征名称 | p值 | OR值 | 95%CI | |
|---|---|---|---|---|
| 下限 | 上限 | |||
| 位置(胰头/胰体/胰尾) | <0.05 | 2.12 | 1.39 | 3.24 |
| 性别(男/女) | <0.05 | 5.58 | 1.57 | 19.84 |
2.1.2 基于LASSO回归算法的深度学习特征和影像组学特征筛选
对深度学习特征做标准化处理,10折交叉验证下选择LASSO拟合过程中均方误差最小的参数λ,此时λ=6.55×10⁻²,LASSO筛选得到4个系数不为0的深度学习特征;对影像组学特征先标准化处理[15],然后使用t检验从856个特征中筛选得到196个特征,再使用LASSO及10折交叉验证的方法,当LASSO算法的均方误差最小时,参数λ=4.94×10⁻²,筛选得到10个系数不为0的影像组学特征.图3(a)和图3(d)分别是对影像组学和深度学习特征做筛选得到的LASSO模型的均方误差图,图3(b)和图3(e)分别是对影像组学和深度学习特征做筛选得到的特征系数收敛图,图3(c)和图3(f)分别是对影像组学和深度学习特征做筛选得到的特征系数图.将保留的深度学习特征以及影像组学特征用于构建MCN和SCN的多源特征分类模型.
图3
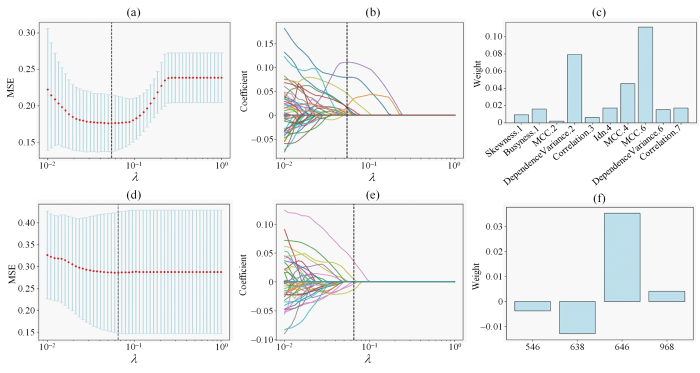
图3
(a)对影像组学特征做筛选得到的LASSO模型MSE图.通过调整λ值使MSE达到最小,以确定最佳λ值;(b)对影像组学特征进行筛选的最优特征系数收敛图;(c) LASSO筛选的影像组学特征权重图,Skewness.1表示偏度,Busyness.1表示复杂度,MCC.2表示形态学相关系数,DependenceVariance.2表示依赖性差异度,Idn.4表示逆差分矩,Correlattion.7表示相关性;(d)对深度学习特征做筛选得到的LASSO模型MSE图;(e)对深度学习特征进行筛选的最优特征系数收敛图;(f) LASSO筛选的深度学习特征权重图
Fig. 3
(a) Mean Square Error (MSE) graphs corresponding to different λ values of radiomics features. The MSE is minimized by adjusting the λ value to determine the optimal λ value; (b) Convergence diagram of the optimal characteristic coefficient of radiomics features; (c) Weight of radiomics features screened by LASSO, Skewness.1 represents skewness, Busyness.1 represents complexity, MCC.2 represents morphological correlation coefficient, DependencyVariance.2 represents dependency difference, Idn.4 represents inverse difference moment, and Correlation.7 represents correlation; (d) Mean square error (MSE) graphs corresponding to different λ values of deep learning features; (e) Convergence diagram of the optimal characteristic coefficient of deep learning features; (f) Weight of deep learning features screened by LASSO
2.1.3 多源特征模型的分类效能及评价
本文基于深度学习的方法构建了MCN和SCN的多源特征分类模型.为了发掘该多源特征模型的分类性能,建立了RAD、DL、RAD_DL、Clinical_RAD_DL特征模型,具体的各模型的效能详见表3. Clinical_RAD_DL特征模型在准确率(0.923 1)、精确率(0.882 0)、AUC(0.912 6)和F1(0.882 2)等多个指标上表现最好.Clinical_RAD_DL特征模型的准确率更高,说明该模型可以更好地对PCN患者进行分类;精确率更高,这代表着更少的误诊和漏诊;虽然Clinical_RAD_DL特征模型的召回率(0.882 4)并不是最高,但是从综合指标F1值来看,该模型有着最佳的综合性能;Clinical_RAD_DL特征模型的AUC值最高,能够反映该模型很好的分类能力.进一步表明,结合临床特征、影像组学特征以及深度学习特征的多源特征模型在分类MCN和SCN中具有优良的效能,且多源特征模型可进一步提高PCN良恶性的鉴别效能.图4(a)、图4(b)、图4(c)和图4(d)分别是4种分类器在RAD、DL、RAD_DL以及Clinical_RAD_DL特征模型中的ROC曲线.
表3 特征模型在4种分类器中的效能
Table 3
| 特征模型 | 分类器 | 准确率 | 召回率 | 精确率 | AUC | F1 | |||
|---|---|---|---|---|---|---|---|---|---|
| RAD | SVM | 0.8077 | 0.5789 | 0.8462 | 0.7592 | 0.6875 | |||
| ADAboost | 0.8269 | 0.6842 | 0.8125 | 0.7967 | 0.7429 | ||||
| Random Forest | 0.7885 | 0.6742 | 0.7222 | 0.7663 | 0.6974 | ||||
| Logistic | 0.8269 | 0.6316 | 0.8571 | 0.7855 | 0.7273 | ||||
| DL | SVM | 0.6731 | 0.1176 | 0.5303 | 0.5595 | 0.1925 | |||
| ADAboost | 0.7692 | 0.9000 | 0.6429 | 0.8645 | 0.7500 | ||||
| Random Forest | 0.7115 | 0.7619 | 0.6154 | 0.8407 | 0.6809 | ||||
| Logistic | 0.7500 | 0.2857 | 0.5714 | 0.5770 | 0.3809 | ||||
| RAD_DL | SVM | 0.8462 | 0.6111 | 0.7908 | 0.8051 | 0.6894 | |||
| ADAboost | 0.8269 | 0.7727 | 0.8095 | 0.6882 | 0.7907 | ||||
| Random Forest | 0.8077 | 0.6364 | 0.8750 | 0.8051 | 0.7369 | ||||
| Logistic | 0.8462 | 0.9444 | 0.7083 | 0.8441 | 0.8095 | ||||
| Clinical_RAD_DL | SVM | 0.8846 | 0.8235 | 0.8235 | 0.8689 | 0.8235 | |||
| ADAboost | 0.8654 | 0.8823 | 0.7500 | 0.8697 | 0.8108 | ||||
| Random Forest | 0.7692 | 0.7059 | 0.6316 | 0.7529 | 0.6667 | ||||
| Logistic | 0.9231 | 0.8824 | 0.8820 | 0.9126 | 0.8822 | ||||
图4
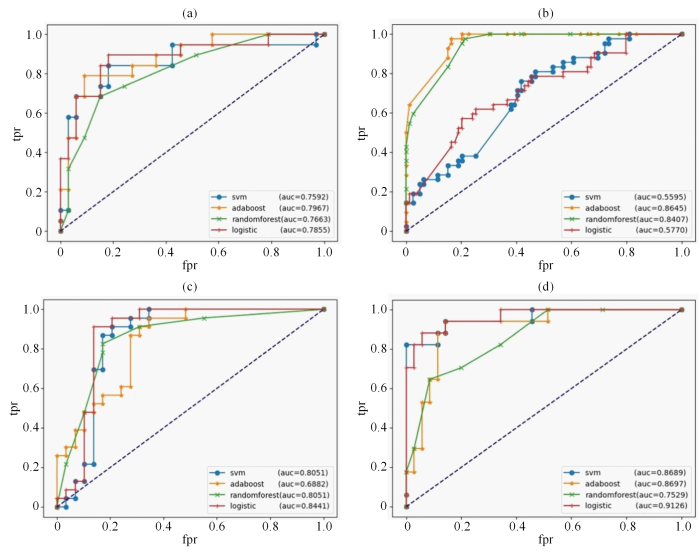
图4
4个特征模型以及各分类器的ROC曲线.横坐标是假阳性率(fpr),纵坐标是真阳性率(tpr),4个分类器分别为SVM(支持向量机)、ADAboost(自适应提升算法)、Random Forest(随机森林)以及Logistic(逻辑回归).(a) RAD特征模型的ROC曲线;(b) DL特征模型的ROC曲线;(c) RAD_DL特征模型的ROC曲线;(d) Clinical_RAD_DL特征模型的ROC曲线
Fig. 4
ROC curve of four characteristic models. The abscissa is fpr (false positive rate) and the ordinate is tpr (true positive rate). The four classifiers are SVM, adaboost (ADAboost), randomforest (Random Forest) and logistic (Logistic). (a) ROC curve used by RAD feature model; (b) ROC curve of DL feature model; (c) ROC curve of RAD_DL feature model; (d) ROC curve of Clinical _RAD_DL feature model
本文基于深度学习构建的多源特征模型准确率最高可达0.923 1,AUC值达0.912 6,高于Liang等[16]将影像组学-DL评分和影像学特征纳入到融合的SCN鉴别诊断模型当中的准确率(0.856 0),以及Wang等[17]基于深度学习特征和影像组学特征构建的腋淋巴结(ALN)诊断模型中SVM分类器最高的AUC值(0.87). 主要的原因是,本研究结合了3种不同来源的PCN的特征,即临床特征、深度学习特征和影像组学特征,以此构建的多源特征模型有更丰富的特征信息,能够更全面的评估PCN;其次,本文对多个分类器都做了调参优化,并对多个分类器进行比较分析;最后,本文选取的深度学习特征提取网络是ResNet50网络,并在训练过程中加入迁移学习和残差模块,缓解深层网络出现的梯度消失问题,减小训练误差.
Delong检验如表4所示,结果显示Clinical_RAD_DL特征模型仅相对于DL特征模型(p=0.029)有统计学意义上的更高效能,与RAD_DL特征模型(p=0.069)、RAD特征模型(p=0.051)之间没有统计学意义上的显著差异.Clinical_RAD_DL特征模型的分类效能需要进一步检验,后续采取校准曲线和决策曲线综合评价Clinical_RAD_DL特征模型的分类效能.
表4 比较Clinical_RAD_DL特征模型和不同模型效能差异的Delong检验的p值
Table 4
| Clinical_RAD_DL与RAD-DL | Clinical_RAD_DL与DL | Clinical_RAD_DL与RAD | |
|---|---|---|---|
| MCN和SCN分类 | 0.069 | 0.029 | 0.051 |
单因素逻辑回归分析和多因素逻辑回归分析获取了差异较大的临床特征,基于LASSO算法获得了最佳的深度学习特征和影像组学特征,使用这些临床特征、深度学习特征和影像组学特征绘制了如图5所示的校准曲线和决策曲线,以便于观察模型的拟合效果和临床价值.
图5
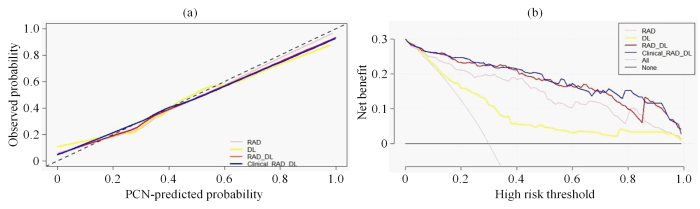
图5
校准曲线和决策曲线. (a) RAD、DL、RAD_DL和Clinical_RAD_DL特征模型的校准曲线. 横坐标表示PCN分类模型的预测概率(PCN-predicted Probability),纵坐标表示实际概率(Observed Probability);(b) RAD、DL、RAD_DL和Clinical_RAD_DL特征模型的决策曲线. 横坐标表示高风险阈值(High Risk Threshold),纵坐标表示模型的净收益(Net Benefit),All曲线表示全部预测成MCN的净收益,None曲线表示全部预测成SCN的净收益
Fig. 5
Calibration curves and decision curves. (a) Calibration curves of RAD, DL, RAD_DL, and Clinical-RAD_DL feature model. The abscissa represents the PCN-predicted probability of PCN classification model, and the ordinate represents the observed probability; (b) Decision curves used by RAD, DL, RAD_DL, and Clinical-RAD_DL feature model. The abscissa represents the high risk threshold, and the ordinate represents the net benefit of the model, the All curve represents the net benefit predicted as MCN, and the None curve represents the net benefit predicted as SCN
在校准曲线中,C值用来度量各模型对MCN预测值与实际值一致性的比例,取值范围是0到1之间,其中1表示完美的一致性,0.5表示随机预测.C值越高,表明该模型的分类准确率越高,参与分类的特征和机器学习分类器的拟合度越高,分类性能越好.结果显示,DL特征模型(C=0.78,95%CI=[0.71,0.85]),RAD特征模型(C=0.89,95%CI=[0.84,0.94]),RAD_DL特征模型(C=0.93,95%CI=[0.90,0.97]),Clinical_RAD_DL特征模型(C=0.94,95%CI=[0.90,0.97]),这表明Clinical_RAD_DL特征模型的特征拟合度最优,模型对MCN和SCN分类的准确度最好.在决策曲线中,阈值范围在0.06~0.98内,4个分类模型的净效益均高于完全预测成MCN或者完全预测成SCN.并且Clinical_RAD_DL特征模型的决策曲线最靠近坐标轴的右上方,从图5(b)中,当阈值范围在0.06~0.73之间,RAD_DL与Clinical_RAD_DL的预测能力比较接近,但是在高范围阈值0.73~0.83内,Clinical_RAD_DL特征模型的预测能力更强.综上,针对MCN和SCN的分类问题,Clinical_RAD_DL特征模型的分类性能最好,临床应用价值最高.
2.2 讨论
本研究采用影像组学和深度学习的方法构建了MCN和SCN的分类模型.使用ResNet50网络提取深度学习特征时,添加了迁移学习,减少模型过拟合带来的影响,面对复杂的PCN图像提取更高级别的深度学习特征.以表3中各组表现最好的分类器为例,Clinical_RAD_DL特征模型比RAD特征模型的准确率提高12%,AUC值提高14%;Clinical_RAD_DL特征模型比DL特征模型中的准确率提高20%,AUC值提高6%;Clinical_RAD_DL特征模型比RAD_DL特征模型的准确率提高9%,AUC值提高8%.深度学习特征和影像组学特征的联合已被证明优于单纯的深度学习或单纯的影像组学[18],我们的实验结果也表明深度学习特征和影像组学特征可能存在互补性.
作为一项回顾性研究,本文还存在以下几点不足:(1)尽管本文包含了大量的PCN病例,但这仍然是一项单中心研究,分类模型的泛化能力还需进一步验证;(2)为了方便临床使用,本文使用的数据是二维单层面数据,相比于三维数据,可能会丢失有关肿瘤异质性的问题;(3)本文仅对PCN的T2WI数据进行建模,PCN的分类标准仍需要根据不同的成像方式进行探讨.今后,我们将在其他磁共振序列图像的基础上,进一步研讨胰腺囊性病变的分类模型,以满足临床个性化治疗的需要.
3 结论
本文针对胰腺浆液性和黏液性囊性肿瘤的分类鉴别问题,建立了基于深度学习的多源特征分类模型,用于PCN的术前辅助诊断.采用深度学习方法和影像组学技术提取深度学习特征和影像组学特征,并对病例的临床特征进行评估和量化,然后采用LASSO及交叉验证的方法分别对深度学习特征和影像组学特征进行筛选,最后构建出两个多源特征模型,即RAD_DL模型和Clinical_RAD_DL模型,并把RAD模型和DL模型作为对照分析,结果表明Clinical_RAD_DL具有较好的分类效果.
致谢
感谢参与本研究的海军军医大学第一附属医院的所有患者和研究人员.
利益冲突
无
参考文献
Chinese guidelines for the diagnosis and treatment of pancreas cystic neoplasm(2022)
[J].
中国胰腺囊性肿瘤诊断指南(2022年)
[J].
The relationship between microscopic tumor size and CT tumor size in pancreatic ductal adenocarcinoma
[J].
DOI:10.1016/j.clinimag.2020.11.039
PMID:33548890
[本文引用: 1]

To investigate the exact relationship between CT tumor size and the microscopic tumor size in PDAC.We enrolled 310 patients with pathologically confirmed PDAC without preoperative adjuvant therapies who underwent CT examination from June 2016 and December 2018. Smooth curve fitting and a segmented regression model were used to analyze the threshold effect between CT tumor size and the microscopic tumor size.The tumor size was 2.93±1.15 cm under the microscope and 3.00±1.23 cm in CT. The mean bias was 0.067 cm between CT and microscopic assessments. The accuracy of CT T stages was 61.02% (36/59), 79.41% (162/204) and 57.45% (27/47) in T1, T2 and T3, respectively. A non-linear relationship was detected between CT tumor size and the microscopic tumor size, with a turning point of 4.3 cm. On the left of the inflection point, the effect size, 95% confidence interval, and p value were 0.51, 0.40 to 0.63, and <0.0001, respectively. However, we observed no relationship between CT size and microscopic tumor size on the right of the inflection point (0.22, 0 to 0.44, 0.053).The relationship between CT and the microscopic tumor size is non-linear. When the CT tumor size was <4.3 cm, every 1-cm increase in CT tumor size was associated with a 0.56 cm increase in microscopic tumor size. When the CT tumor size was >4.3 cm, every 1-cm increase in CT tumor size was associated with a 0.91 cm increase in microscopic tumor size.Copyright © 2020 Elsevier Inc. All rights reserved.
CT radiomics to predict high-risk intraductal papillary mucinous neoplasms of the pancreas
[J].
DOI:10.1002/mp.13159
PMID:30176047
[本文引用: 1]
Intraductal papillary mucinous neoplasms (IPMNs) are radiographically visible precursor lesions of pancreatic cancer. Despite standard criteria for assessing risk, only 18% of cysts are malignant at resection. Thus, a large number of patients undergo unnecessary invasive surgery for benign disease. The ability to identify IPMNs with low or high risk of transforming into invasive cancer would optimize patient selection and improve surgical decision-making. The purpose of this study was to investigate quantitative CT imaging features as markers for objective assessment of IPMN risk.This retrospective study analyzed pancreatic cyst and parenchyma regions extracted from CT scans in 103 patients to predict IPMN risk. Patients who underwent resection between 2005 and 2015 with pathologically proven branch duct (BD)-IPMN and a preoperative CT scan were included in the study. Expert pathologists categorized IPMNs as low or high risk following resection as part of routine clinical care. We extracted new radiographically inspired features as well as standard texture features and designed prediction models for the categorization of high- and low-risk IPMNs. Five clinical variables were also combined with imaging features to design prediction models.Using images from 103 patients and tenfold cross-validation technique, the novel radiographically inspired imaging features achieved an area under the receiver operating characteristic curve (AUC) of 0.77, demonstrating their predictive power. The combination of these features with clinical variables obtained the best performance (AUC = 0.81).The present study demonstrates that features extracted from pretreatment CT images can predict the risk of IPMN. Development of a preoperative model to discriminate between low-risk and high-risk IPMN will improve surgical decision-making.© 2018 American Association of Physicists in Medicine.
Machine and deep learning methods for radiomics
[J].
DOI:10.1002/mp.13678
PMID:32418336
[本文引用: 1]
Radiomics is an emerging area in quantitative image analysis that aims to relate large-scale extracted imaging information to clinical and biological endpoints. The development of quantitative imaging methods along with machine learning has enabled the opportunity to move data science research towards translation for more personalized cancer treatments. Accumulating evidence has indeed demonstrated that noninvasive advanced imaging analytics, that is, radiomics, can reveal key components of tumor phenotype for multiple three-dimensional lesions at multiple time points over and beyond the course of treatment. These developments in the use of CT, PET, US, and MR imaging could augment patient stratification and prognostication buttressing emerging targeted therapeutic approaches. In recent years, deep learning architectures have demonstrated their tremendous potential for image segmentation, reconstruction, recognition, and classification. Many powerful open-source and commercial platforms are currently available to embark in new research areas of radiomics. Quantitative imaging research, however, is complex and key statistical principles should be followed to realize its full potential. The field of radiomics, in particular, requires a renewed focus on optimal study design/reporting practices and standardization of image acquisition, feature calculation, and rigorous statistical analysis for the field to move forward. In this article, the role of machine and deep learning as a major computational vehicle for advanced model building of radiomics-based signatures or classifiers, and diverse clinical applications, working principles, research opportunities, and available computational platforms for radiomics will be reviewed with examples drawn primarily from oncology. We also address issues related to common applications in medical physics, such as standardization, feature extraction, model building, and validation.© 2019 American Association of Physicists in Medicine.
Classification of BI-RADS 3-5 breast lesions based on MRI radiomics
[J].
基于MRI影像组学的BI-RADS 3-5类乳腺病变三分类
[J].
Feature-guided deep radiomics for glioblastoma patient survival prediction
[J].DOI:10.3389/fnins.2019.00966 URL [本文引用: 1]
CT Radiomics features in differentiation of focal-type autoimmune pancreatitis from pancreatic ductal adenocarcinoma: a propensity score analysis
[J].
DOI:10.1016/j.acra.2021.04.014
PMID:34108115
[本文引用: 2]
To evaluate the diagnostic performance of the radiomics score (rad-score) for differentiating focal-type autoimmune pancreatitis (fAIP) from pancreatic ductal adenocarcinoma (PDAC).This retrospective review included 42 consecutive patients with fAIP diagnosed according to the International Consensus Diagnostic Criteria between January 2011 and December 2018. Furthermore, 334 consecutive patients with PDAC confirmed by pathology were also reviewed during the same period. Patients with PDAC and fAIP were matched via propensity score matching (PSM). All patients underwent multidetector computed tomography (MDCT). For each patient, 1409 radiomics features of the portal phase were extracted and reduced using the least absolute shrinkage and selection operator (LASSO) logistic regression algorithm. The portal rad-score performance was assessed based on its discriminative ability.After PSM, we matched 55 patients with PDAC to 42 patients with fAIP, based on clinical and CT characteristics (e.g., patient age, sex, body mass index, location, size, enhanced mode). A rad-score for discriminating fAIP from PDAC, which contained four CT derived radiomic features, was developed (area under the curve = 0.97). The sensitivity, specificity, and accuracy of the radiomics model were 95.24%, 92.73% and 0.94, respectively.The portal rad-score can accurately and noninvasively differentiate fAIP from PDAC.Copyright © 2021 The Association of University Radiologists. Published by Elsevier Inc. All rights reserved.
Using quantitative imaging for personalized medicine in pancreatic cancer: a review of radiomics and deep learning applications
[J].
DOI:10.3390/cancers14071654
URL
[本文引用: 1]
As the most lethal major cancer, pancreatic cancer is a global healthcare challenge. Personalized medicine utilizing cutting-edge multi-omics data holds potential for major breakthroughs in tackling this critical problem. Radiomics and deep learning, two trendy quantitative imaging methods that take advantage of data science and modern medical imaging, have shown increasing promise in advancing the precision management of pancreatic cancer via diagnosing of precursor diseases, early detection, accurate diagnosis, and treatment personalization and optimization. Radiomics employs manually-crafted features, while deep learning applies computer-generated automatic features. These two methods aim to mine hidden information in medical images that is missed by conventional radiology and gain insights by systematically comparing the quantitative image information across different patients in order to characterize unique imaging phenotypes. Both methods have been studied and applied in various pancreatic cancer clinical applications. In this review, we begin with an introduction to the clinical problems and the technology. After providing technical overviews of the two methods, this review focuses on the current progress of clinical applications in precancerous lesion diagnosis, pancreatic cancer detection and diagnosis, prognosis prediction, treatment stratification, and radiogenomics. The limitations of current studies and methods are discussed, along with future directions. With better standardization and optimization of the workflow from image acquisition to analysis and with larger and especially prospective high-quality datasets, radiomics and deep learning methods could show real hope in the battle against pancreatic cancer through big data-based high-precision personalization.
Deep learning-based differentiation between mucinous cystic neoplasm and serous cystic neoplasm in the pancreas using endoscopic ultrasonography
[J].
Differentiation of benign and malignant breast lesions based on multimodal MRI and deep learning
[J].
基于多模态MRI与深度学习的乳腺病变良恶性鉴别
[J].
Value of CT texture analysis in differentiating pancreatic serous cystadenoma from mucinous cystadenoma
[J].
CT纹理分析在鉴别胰腺浆液性囊腺瘤与黏液性囊腺瘤中的价值
[J].
Deep learning-based detection of solid and cystic pancreatic neoplasms at contrast-enhanced CT
[J].DOI:10.1148/radiol.220171 URL [本文引用: 2]
Improving performance of breast lesion classification using a ResNet50 model optimized with a novel attention mechanism
[J].
DOI:10.3390/tomography8050200
PMID:36287799
[本文引用: 1]
The accurate classification between malignant and benign breast lesions detected on mammograms is a crucial but difficult challenge for reducing false-positive recall rates and improving the efficacy of breast cancer screening. This study aims to optimize a new deep transfer learning model by implementing a novel attention mechanism in order to improve the accuracy of breast lesion classification. ResNet50 is selected as the base model to develop a new deep transfer learning model. To enhance the accuracy of breast lesion classification, we propose adding a convolutional block attention module (CBAM) to the standard ResNet50 model and optimizing a new model for this task. We assembled a large dataset with 4280 mammograms depicting suspicious soft-tissue mass-type lesions. A region of interest (ROI) is extracted from each image based on lesion center. Among them, 2480 and 1800 ROIs depict verified benign and malignant lesions, respectively. The image dataset is randomly split into two subsets with a ratio of 9:1 five times to train and test two ResNet50 models with and without using CBAM. Using the area under ROC curve (AUC) as an evaluation index, the new CBAM-based ResNet50 model yields AUC = 0.866 ± 0.015, which is significantly higher than that obtained by the standard ResNet50 model (AUC = 0.772 ± 0.008) (< 0.01). This study demonstrates that although deep transfer learning technology attracted broad research interest in medical-imaging informatic fields, adding a new attention mechanism to optimize deep transfer learning models for specific application tasks can play an important role in further improving model performances.
Breast tumor computer-aided detection system based on magnetic resonance imaging using convolutional neural network
[J].
Classification prediction of pancreatic cystic neoplasms based on radiomics deep learning models
[J].
DOI:10.1186/s12885-022-10273-4
PMID:36447168
[本文引用: 1]
Preoperative prediction of pancreatic cystic neoplasm (PCN) differentiation has significant value for the implementation of personalized diagnosis and treatment plans. This study aimed to build radiomics deep learning (DL) models using computed tomography (CT) data for the preoperative differential diagnosis of common cystic tumors of the pancreas.Clinical and CT data of 193 patients with PCN were collected for this study. Among these patients, 99 were pathologically diagnosed with pancreatic serous cystadenoma (SCA), 55 were diagnosed with mucinous cystadenoma (MCA) and 39 were diagnosed with intraductal papillary mucinous neoplasm (IPMN). The regions of interest (ROIs) were obtained based on manual image segmentation of CT slices. The radiomics and radiomics-DL models were constructed using support vector machines (SVMs). Moreover, based on the fusion of clinical and radiological features, the best combined feature set was obtained according to the Akaike information criterion (AIC) analysis. Then the fused model was constructed using logistic regression.For the SCA differential diagnosis, the fused model performed the best and obtained an average area under the curve (AUC) of 0.916. It had a best feature set including position, polycystic features (≥6), cystic wall calcification, pancreatic duct dilatation and radiomics-DL score. For the MCA and IPMN differential diagnosis, the fused model with AUC of 0.973 had a best feature set including age, communication with the pancreatic duct and radiomics score.The radiomics, radiomics-DL and fused models based on CT images have a favorable differential diagnostic performance for SCA, MCA and IPMN. These findings may be beneficial for the exploration of individualized management strategies.© 2022. The Author(s).
A nomogram based on radiomics signature and deep-learning signature for preoperative prediction of axillary lymph node metastasis in breast cancer
[J].
CT-based radiomics analysis for preoperative diagnosis of pancreatic mucinous cystic neoplasm and atypical serous cystadenomas
[J].
DOI:10.3389/fonc.2021.621520
URL
[本文引用: 1]
To investigate the value of CT-based radiomics analysis in preoperatively discriminating pancreatic mucinous cystic neoplasms (MCN) and atypical serous cystadenomas (ASCN).
A nomogram for predicting pancreatic mucinous cystic neoplasm and serous cystic neoplasm
[J].
