引言
胰腺是人体重要的组织器官之一,根据数据显示,胰腺囊性肿瘤(pancreatic cystic neoplasms,PCNs)在一般人群中的发病率大约在4%~14%,并且还在不断升高[1 ] .PCNs主要包括四种类型:胰腺导管内乳头状黏液肿瘤(IPMN)、实性假乳头状瘤(SPN)、浆液性囊性肿瘤(SCN)和黏液性囊性肿瘤(MCN).其中SCN和MCN是最常见的胰腺囊性肿瘤,SCN属于良性肿瘤,一般以随访为主,出现临床症状后再考虑手术切除,而MCN具有恶变潜能,生长较快,有癌变的风险[2 ] .有文献[3 ] 统计,目前对于胰腺囊性肿瘤的术前诊断准确率仅有60%~70%,很多患者进行了不必要的手术,而相关手术通常有20%~40%的复发率和大约2%的死亡率[1 ] ,因此SCN和MCN的鉴别诊断对于选择合适的治疗方案有着重要的临床意义.
目前,对于胰腺囊性肿瘤的诊断方式有超声、CT、MRI等[4 ] .SCN的典型表现为微囊型及蜂窝型,边界清楚,在MRI中T 1 加权像呈低信号,在T 2 加权像呈高信号.MCN大多直径较大,多发于胰腺体尾部,其MRI成像特征为:清亮囊内容物在T 1 加权像呈低信号,胶冻样囊内容物呈高信号,信号强度可能随囊内容物含量而变化,在T 2 加权像呈现出相间的形式[5 ] .目前MRI诊断胰腺囊性肿瘤的准确率在40%~95%之间[6 ] ,相对来说还较低.然而SCN中表现为典型结构的仅占全部的30%[6 ] ,其余SCN形态各异,其中表现为较大单囊结构的SCN在外观形态上与MCN无差异,因此经常被误诊为MCN,导致其人工分类时准确率不高.
近年来对于胰腺囊性肿瘤的识别诊断得到了部分学者的关注和研究,对于胰腺囊性肿瘤的发现和治疗起到了积极作用.Yuan等[7 ] 提出了一种基于不相似度的影像组学特征融合的胰腺囊性肿瘤分类方法,对MCN和SCN的CT图像进行分类,准确率达0.862,有效提高了胰腺囊性肿瘤分类的准确率.Zhang等[8 ] 回顾分析46例SCN和29例MCN患者术前CT静脉期图像,构建临床影像学特征模型、CT纹理特征模型以及两者的综合模型,其中临床影像学特征模型AUC值为0.814,CT纹理特征模型AUC值为0.866,两者综合模型的ROC曲线下面积(AUC值)达到了0.938,证明了CT纹理分析有助于SCN和MCN的鉴别诊断.Chen等[9 ] 基于CT影像组学方法,建立6种机器学习模型,对37例SCN患者和28例MCN患者的CT图像进行训练和验证,其中人工神经网络模型表现最佳,准确率达0.895,AUC值为0.92.
以上学者主要都是基于影像组学的方法对胰腺囊性肿瘤进行识别分类,而近年来随着计算机技术的快速发展,基于深度学习的医学图像分类应用越来越广泛[10 ,11 ] ,也达到了不错的效果.深度学习在输入层与输出层之间使用隐藏层来对数据的中间表征建模,能够使计算机自动地从图像中获得更深层次和更抽象的特征,有效排除人为因素的影响,易于实现全自动化,可以节省时间和精力,能够有效提高MCN和SCN的诊断精确度.深度学习一般需要大量的数据进行训练,在处理医学图像分类问题时,由于临床数据量较小,模型容易过拟合,而迁移学习一定程度上可以解决这一问题并且提高学习效率,使得模型初始性能更高,在深度学习分类任务中发挥了重要作用.Nguon等[12 ] 使用卷积神经网络ResNet50和迁移学习来区分MCN和SCN,通过改变内窥镜超声(EUS)图像的大小和位置来评估网络的区分性能,微调后准确率达到0.827 5,AUC值为0.88.Vilas-Boas[13 ] 等人针对胰腺囊肿的内窥镜超声图像,提出一种卷积神经网络算法,区分黏液性和非黏液性胰腺囊性病变,其中前者包括IPMN和MCN,后者包括SCN及假性囊性病变,该模型总体准确率达到0.985.
总的来说,目前MCN和SCN在临床上误诊率较高,基于影像组学的方法对于MCN和SCN的识别分类准确率还有待提高,基于深度学习对于MCN和SCN MRI数据进行分类识别的研究还较少.因此针对以上问题,本文提出一种基于深度学习的胰腺囊性肿瘤分类方法,采用DenseNet网络模型结合迁移学习并对其进行微调,以提高对MCN和SCN的识别效果,辅助医生在临床上的准确诊断,为临床治疗方式上的选择提供依据,为后续对胰腺囊性肿瘤的识别诊断研究提供思路.
1 实验部分
1.1 模型与方法
1.1.1 DenseNet
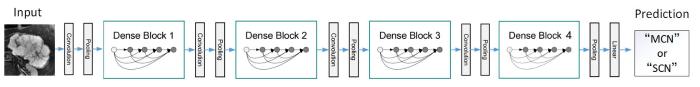
DenseNet(Dense Convolutional Network)是Huang[14 ] 等在2017年提出的最佳深度学习网络,它不同于ResNet提升网络性能的方法,其核心思想是密集连接,建立不同层之间的连接关系,充分利用每一层的特征信息,提升网络的训练效果.DenseNet主要由多个密集块(Dense Block)和过渡层(Transition Layer)组成,Dense Block每一层都与前面所有层相连接,使用级联(Concatenation)方式,并保持每一层的特征图大小相同,相邻Dense Block之间由Transition Layer连接,通过批量归一化层、激活层、卷积层(Convolution)以及池化层(Pooling)实现降采样,使用1×1卷积减少通道数,通过池化以降低特征图大小,起到压缩模型的作用.
在一般卷积神经网络中,第l 层有l 个连接,而在DenseNet中,第l 层有$l(l+1)/2$个连接,其每一层的输入都是前面所有层的输出.即一般的网络在第l 层的输出为:
(1) ${{x}_{l}}={{H}_{l}}({{x}_{l-1}})$
而在DenseNet中,会连接前面每一层作为输入:
(2) ${{x}_{l}}={{H}_{l}}([{{x}_{0}},{{x}_{1}},\cdots,{{x}_{l-1}}])$
其中${{H}_{l}}(\cdot )$表示非线性转化函数,包括批量归一化、激活、卷积等操作.如果每个${{H}_{l}}(\cdot )$后输出k 个特征图,即得到的特征图通道数为k ,这个超参数k 在DenseNet中称为增长率(growth rate),一般情况下,使用较小的增长率(比如k = 12)可以使得网络变窄,减少参数,获得较佳的网络性能[14 ] .因此与其他卷积神经网络对比,DenseNet是一种隐式的强监督模式,通过加强每一层的输入,增强了特征在网络模型中的传播,实现了特征重用,并且每一层都可以直接访问来自损失函数和原始输入信号的梯度,提升了梯度的反向传播,使得网络更容易训练,既一定程度上减少了网络的参数量,又减轻了梯度消失的问题.
由于DenseNet出色的性能,其密集连接块可以利用到更多深层次的特征,目前被广泛应用于医学图像分类任务中.Zhou等[15 ] 将3D DenseNet与SENet相结合,对两级肝细胞癌进行分级,准确率可达0.83,表现出了优异性能.Wang等[16 ] 提出一种基于改进的FC-DenseNet对微动脉瘤进行检测,结果表明,所提出的MAS-FC-DenseNet是一种快速、准确检测出微动脉瘤的可靠模型,可用于糖尿病视网膜病变的筛查.Guo等[17 ] 基于改进的DenseNet(SK-DenseNet)对间质性肺疾病进行分类诊断,最佳结果达到0.984. Yang等[18 ] 使用DenseNet结合迁移学习的方法对不同放大倍数的乳腺癌图像进行识别,其准确率达到了0.98以上.以上研究证明DenseNet在医学图像分类任务中表现出了良好的性能,拥有较强的特征提取能力,因此选用DenseNet网络对MCN和SCN进行分类,以解决临床上人工分类准确率不高的问题.
通过比较不同卷积层数的DenseNet网络,分别采用DenseNet121、DenseNet161、DenseNet169和DenseNet201对本文数据集进行识别分类,并调节网络的超参数使模型达到最好的效果,发现DenseNet161对MCN和SCN的分类准确率最高,模型收敛情况最好,因此本文选择DenseNet161为基础网络模型对胰腺囊性肿瘤进行分类.表1 为DenseNet161网络结构,图1 为MCN和SCN从样本输入到分类结果输出的整体流程图.
图1
图1
MCN与SCN分类流程图
Fig. 1
MCN and SCN classification flowchart
1.1.2 迁移学习
深度学习依赖于大量的标注数据,而在医学图像领域,这需要有经验的医生花费大量的时间和精力进行标注,数据量不足是常见的问题.迁移学习技术指将先前领域学习到的特征和参数应用到新领域的手段,可以解决当前数据量不足的问题并且提高学习效率,增强模型的稳定性和泛化能力[19 ] .因此在医学图像领域可以提高疾病鉴别诊断的性能.迁移学习一般通过ImageNet数据集进行分类预训练[20 ] ,将预训练得到的网络模型初始化参数迁移到目标数据集进行微调训练.迁移学习可以学习到许多基本特征如边缘等,可以简化模型的调参过程以及减少训练时间,并且可以减少对大量数据的需求,有助于提高对目标数据集的分类能力.
1.2 实验设计
1.2.1 数据集
磁共振作为一种无创无辐射的检查方式,有较高的软组织和空间分辨率,对胰腺病灶的诊断有较高的敏感性和特异性,能够为胰腺囊性肿瘤的诊断提供丰富的信息,尤其是磁共振T 2 加权图像能够清晰地观察到SCN与MCN的病灶部位,因此本文基于胰腺囊腺肿瘤患者的腹部磁共振T 2 加权图像进行研究.
本文使用的数据集来自长海医院172例胰腺囊腺肿瘤患者的腹部磁共振T 2 加权图像,其中包含65个MCN病例(男性3例,女性62例,平均年龄51.9±12.5岁)以及107个SCN病例(男性25例,女性82例,平均年龄48.7±15.1岁),所有患者均提供书面知情同意书,本研究经长海医院生物医学研究伦理委员会审核通过.所有患者均使用3.0 T系统(Signa Excite 3.0 T,GE Healthcare,Milwaukee,USA;Signa HDxt MR750 3.0 T,GE Healthcare;Skyra 3.0 T,Siemens,Erlangen,Germany)进行胰腺动态增强MRI检查,采取仰卧位,相控阵接收器线圈覆盖上腹部,采用屏气单次快速自旋回波冠状T 2 加权序列(TR/TE = 6316/87 ms;视场= 360×420 mm2 ;矩阵= 224×270;切片厚度= 5 mm;切片间隙= 1 mm),所有MR图像都由3名经长海医院委员会认证的腹部放射科医生分析,标记出胰腺肿瘤的部位.
1.2.2 数据预处理
由于胰腺体积较小,周围的器官组织较多,为避免周围组织对本研究的影响,本文将胰腺肿瘤部位作为ROI进行手动提取,由于每个病例肿瘤大小及位置不同,其磁共振图像包含肿瘤的层数不同,因此每个病例可以提取5~20张图像不等,最终得到MCN和SCN图像各430张.
深度学习模型需要大量数据支撑,数据量过少会导致模型过拟合等问题.因此本文通过数据扩增获得更多的数据,可以在保持泛化能力的同时学习到更多数据的特征.为了满足本研究的数据需求,将数据进行5倍扩增,操作包括:上下翻转、左右翻转、旋转等.最终得到MCN、SCN图像共4 300张,并将所有图像大小统一为224×224,统一做归一化处理.
1.2.3 模型训练策略
实验构建DenseNet161迁移学习模型对MCN、SCN图像进行分类,并对数据集按不同病例的图像以8:2比例进行训练集和测试集的划分.实验操作系统为Windows11,主要开发环境为Python3.7,深度学习网络基于Pytorch.
为了提高模型的精确度,需调整网络的超参数.对模型的批大小(batch size)进行调整可以减少训练时间,当初始学习率为0.001时,实验经过比较batch size为4、8、16、32时的准确率及训练时间,发现当batch size为16时,分类准确率最高,且所需时间较少,继续增大batch size可以继续减少训练时间,但模型精度有所下降,因此在batch size为16时继续调整初始学习率.对初始学习率进行调整可以提高模型的收敛效果,进而提高模型精度.将初始学习率分别设置为0.001~0.000 01之间,当初始学习率为0.000 5时,准确率最高,收敛函数值最小,模型收敛效果最好.因此本实验最终确定初始学习率设置为0.000 5,batch size设置为16.
实验过程采用五折交叉验证,以确保实验的可靠性和准确性,并且动态调整学习率,随着epoch的增加减小学习率,学习率衰减速率为0.1,以保证模型在训练后期不会有较大波动,从而更加接近最优解.实验过程中,为防止过拟合问题,加入丢弃(Dropout)操作,丢弃率(Drop_rate)设置为0.2.
加入优化算法可以提高网络的收敛速度,本文选用SGD[17 ] 、Adam[21 ] 、Adadelta[22 ] 、Adagrad[23 ] 、ASGD[24 ] 五种优化算法与DenseNet161网络结合,来验证网络结构的分类性能,实验结果表明,加入SGD优化算法后,动量(momentum)设置为0.9,网络模型的分类准确率最高,其收敛速度也较快.最后对网络模型进行微调整,选择归一化指数函数(softmax)激活函数结合分类器输出分类结果.
1.2.4 评价指标
为了客观全面评价深度学习模型的性能,本文将采用准确率(Accuracy,ACC)、精确率(Precision,P )、召回率(Recall,R )、特异性(Specificity)、F1-score以及ROC曲线和AUC值来评估实验结果,相关概念描述如下:
(3) $\text{ACC}=(\operatorname{TP}+\text{TN})/(\text{TP}+\text{FP}+\text{TN}+\text{FN})$
(4) $P=\operatorname{TP}/(\text{TP}+\text{FP})$
(5) $R=\operatorname{TP}/(\text{TP}+\text{FN})$
(6) $\text{Specificity}=\text{TN}/(\text{TN}+\text{FP})$
(7) $\text{F1-score}=2P\cdot R/(P+R)$
其中TP为真正例,即真值是正例,预测值也是正例;TN是真负例,即真值是负例,预测值也是负例;FP是伪正例,即真值是负例,预测值是正例;FN是伪负例,即真值是正例,预测值为负例,本文中SCN的指标是将SCN设置为正例,MCN设置为负例进行计算,MCN的指标是将MCN设为正例,SCN设为负例进行计算.除表3 外,本文其他数据均以MCN的指标表示.
ROC曲线为受试者工作特征曲线,以假阳性概率(False positive rate)为横轴,真阳性(True positive rate)为纵轴,AUC值即为ROC曲线下面积,AUC值越接近1表示模型分类效果越好,反之模型分类效果越差.
2 结果与讨论
2.1 迁移学习实验结果
本文采用数据集ImageNet首先对DenseNet161网络模型进行预训练,然后将训练后得到的网络参数予以迁移,在本文数据集上进行微调训练,以减少对数据量的需求,达到提高胰腺囊性肿瘤分类精度的目的.表2 为DenseNet161网络在本文数据集上从头训练与结合迁移学习后进行微调训练的实验结果.
由表2 结果看出,迁移后的模型性能有较大提升,准确率以及AUC值都达到了不错的结果,远高于未迁移的模型,证明迁移后的分类模型学习能力更强,分类效果更好,因此本文后续实验均基于迁移学习的模型进行.
为了更详细地展现迁移后DenseNet161模型的分类效果,本文在表现最优的模型参数方案上,取SCN和MCN在Accuracy、Precision、Recall和F1-Score 4项评价指标上的表现做详细分析.各项指标数据如表3 所示.
由表3 中数据可知,DenseNet161模型结合迁移学习对MCN和SCN的识别准确率可以达到0.943,Precision、Recall和F1-Score的各自平均值也达到了0.943,且SCN与MCN各项指标差异不大,说明本文数据样本均衡,有利于模型的学习.
2.2 与其他深度学习模型的对比结果
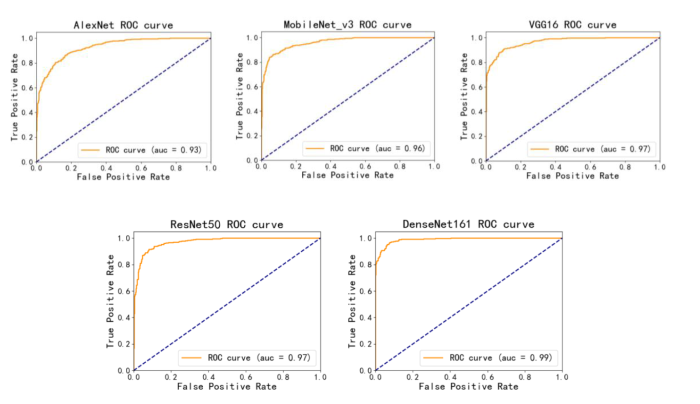
为了验证本文方案的可行性,将本文方法与其他深度学习模型AlexNet、MobileNet_v3、Vgg16以及ResNet50应用于MCN和SCN识别的性能进行比较,这些深度模型均是常用于图像分类任务中的模型,其中ResNet50已被应用于MCN与SCN的鉴别诊断中[7 ] .对比实验结果如表4 所示,图2 和图3 为不同模型的ROC曲线和混淆矩阵.
图2
图2
不同模型的ROC曲线及曲线下面积
Fig. 2
ROC curve and area under curve of different models
图3
图3
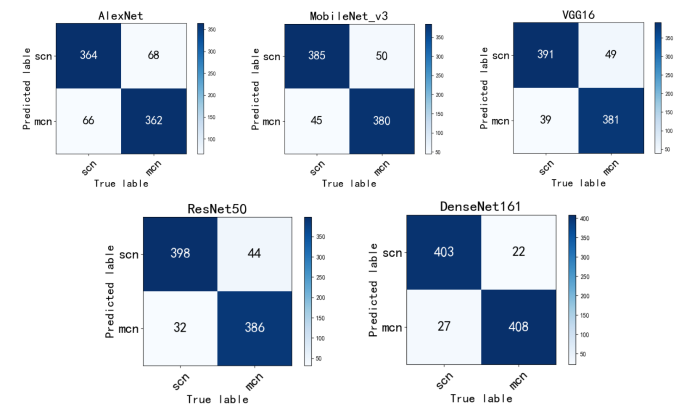
不同模型的混淆矩阵
Fig. 3
Confusion matrix of different models
由表4 和图2 不同模型的ROC曲线可以看出,使用DenseNet161结合迁移学习的模型对MCN和SCN进行分类时,所有的评价指标均是最好的,以MCN为正例计算得到AUC值达到0.989,分类准确率达到0.943,召回率为0.949,F1-score为0.943,其ROC曲线更平滑,波动幅度较小,且其参数量适中.图3 混淆矩阵可以观察MCN与SCN的分类情况,其中,每一列表示真实类别,每一行表示预测的类别,深色对角线上则表示每一类被正确预测的个数,浅色对角线上的数值表示每一类被预测为其他类别的个数。从图中可以明显看出,本文DenseNet161结合迁移学习的模型对MCN和SCN预测正确的个数最多,并且对于MCN预测正确的个数较其他模型有明显增加,说明本文模型学习到了更多MCN的特征,对MCN有更好的识别性能,并且保证了SCN的识别准确性.因此经过综合比较,证明本文使用的模型具有良好的胰腺黏液性囊性肿瘤和浆液性囊性肿瘤的诊断性能.
2.3 与其他文献方法的对比结果
将本文方法与其他文献中对于MCN和SCN识别的方法进行对比,其结果如表5 所示.
由表5 看出,文献[7 ]、文献[8 ]、文献[9 ]均是基于影像组学的方法,提取不同的影像组学特征对MCN和SCN进行识别分类,并且使用的数据都是胰腺囊性肿瘤的CT图像,文献[7 ]、文献[9 ]准确率分别为0.862、0.895,文献[8 ]的AUC值达到0.938,证明影像组学特征对于胰腺囊性肿瘤的识别分类有良好的效果,但其准确率还有待提高.文献[12 ]是基于深度学习的方法对MCN与SCN的内窥镜超声图像进行分类,对Resnet50结合迁移学习的模型进行微调,AUC达到0.88,证明了深度学习对胰腺囊性肿瘤进行鉴别诊断的可行性,但其准确率并不是很高,仅有0.828,其原因与内窥镜的扫描条件有关,内窥镜超声图像与成像目标的表面距离不同,且其成像为动态图像,因此较难选取合适的成像帧,会对后续的实验造成一定影响.而本文基于DenseNet161和迁移学习的模型对SCN和MCN的MR图像分类准确率达到了0.943,AUC值达到了0.989,高于以上所有方法,证明该模型学习到了图像中更深层次的特征,有较强的学习能力,对MCN和SCN有较好的分类效果.
3 结论
本文基于卷积神经网络DenseNet161,实现MCN和SCN图像的分类,利用数据扩增的办法增加训练样本,解决原始数据集较少的问题.通过对迁移学习获得的网络模型进行微调,并结合dropout操作避免过拟合问题,采用五折交叉验证策略,从准确率、精确率、召回率、F1-score和AUC值等方面对模型性能进行评估.结果表明,结合迁移学习的DenseNet161网络模型对MCN与SCN的分类准确率要远高于未结合迁移学习的模型,且此模型在与其他深度学习模型对比实验中表现最优,各项指标均达到最好,AUC值达到0.989,分类准确率达到0.943,召回率为0.949,精确率为0.938,特异性为0.937,F1-score为0.943.在与其他文献中对于MCN和SCN的识别方法对比中,也表现出了最佳的性能,其准确率均高于其他影像组学及深度学习的方法.因此本研究所使用的分类模型是一种可行的、有效的胰腺囊性肿瘤诊断方法,具有较高的特征学习能力,有助于医生在临床诊断中提高效率和准确率,为临床上治疗方法的选择提供可靠依据,减少不必要的手术,一定程度上节省人力物力.
但本研究还存在一定局限性:深度学习需要尽可能多的数据集,本文患者数量相对较少,数据量还不够充足,未来可能需要更大的数据集,这对模型的优化有更重要的意义.现已有研究表明融合多模态特征进行医学图像分类的优越性[10 ] ,本文使用单模态数据进行实验,一是表5 中的其他方法均使用单模态数据,便于与其对比,二是本文重点在于深度学习模型的选择以及构建,后续研究将融合SCN和MCN的多模态数据,进一步提升模型性能.综上所述,本研究基于DenseNet161结合迁移学习对于SCN和MCN有较好的诊断性能,提高了胰腺囊性肿瘤诊断的精确度,证明了该模型在胰腺囊性肿瘤MR图像识别中具有较大优势和重要的临床意义,后续工作将继续致力于提高胰腺囊性肿瘤识别分类的准确性,并促进相关研究成果真正应用于临床,服务于广大患者.
利益冲突
致谢
感谢参与本研究的海军军医大学第一附属医院的所有患者和研究人员.
参考文献
View Option
[1]
ARDESHNA D R CAO T RODGERS B , et al . Recent advances in the diagnostic evaluation of pancreatic cystic lesions
[J]. World J Gastroenterol , 2022 , 28 (6 ): 624 -634 .
DOI:10.3748/wjg.v28.i6.624
URL
[本文引用: 2]
[2]
XU X B CHEN H SUN B . Progress in diagnosis and treatment of pancreatic cystic tumors
[J]. Chinese Journal of Operative Procedures of General Surgery (Electronic Edition) , 2020 , 14 (6 ): 643 -646 .
[本文引用: 1]
徐西伯 , 陈华 , 孙备 . 胰腺囊性肿瘤的诊治进展
[J]. 中华普外科手术学杂志(电子版) , 2020 , 14 (6 ): 643 -646 .
[本文引用: 1]
[3]
JANG D K SONG B J RYU J K , et al . Preoperative diagnosis of pancreatic cystic lesions: the accuracy of endoscopic ultrasound and cross-sectional imaging
[J]. Pancreas , 2015 , 44 (8 ): 1329 -1333 .
DOI:10.1097/MPA.0000000000000396
URL
[本文引用: 1]
[4]
SUN Y YANG S QI E , et al . Comparative diagnostic evaluation with contrast-enhanced ultrasound, computed tomography and magnetic resonance imaging in patients with pancreatic cystic neoplasms
[J]. Cancer Manag Res , 2020 , 12 : 2889 -2898 .
DOI:10.2147/CMAR.S246564
PMID:32425602
[本文引用: 1]
The purpose of our study was to evaluate the role of contrast-enhanced ultrasound (CEUS) with magnetic resonance imaging (MRI) and computed tomography (CT) in the pathological diagnosis of pancreatic cystic neoplasms (PCNs).A total of 90 patients (66 women, 24 men) aged 18-71 years were studied prospectively. CEUS was performed in all patients, whereas MRI was performed in 85 patients and CT in 69 patients. We analyzed the sensitivity and accuracy of these three imaging modalities to diagnose the PCNs. Neoplasm size, location, shape, intralesional mural nodules, septa and duct dilatation were also assessed by different radiologists.There were no significant differences in sensitivity for discriminating PCNs from pancreatic cystic lesions between CEUS and MRI (p=0.614) or between CEUS and CT (p=0.479). The diagnostic accuracy of CEUS for classifying PCNs was 64.4% (58/90), which was higher than that of CT (53.6%, 37/69, P=0.017), and lower than that of MRI (70.6%, 60/85, p=0.791). Regarding tumor size for lesions larger than 3 cm, CEUS was superior to CT in differentiating the specific type of PCN (p=0.041), and CEUS had the same value as MRI (p=0.774). Furthermore, CEUS is valuable for precisely characterizing internal structures, for instance, septa (p=0.003, compared with CT; p=0.443, compared with MRI) and nodules (p= 0.018, compared with CT; p=0.033, compared with MRI). The number of septa (p=0.033) and cyst morphology (p=0.016) were meaningful indicators in differentiating serous and mucinous adenoma. There was no significant difference in evaluating size and detecting duct dilatation among the three imaging methods.CEUS compares favorably with MRI in displaying the inner structure of PCNs and offers advantages over CT. CEUS can contribute in an important way to the diagnosis of pancreatic cystic neoplasms.© 2020 Sun et al.
[5]
BOLLEN T L WESSELS F J . Radiological workup of cystic neoplasms of the pancreas
[J]. Visceral Med , 2018 , 34 (3 ): 182 -190 .
DOI:10.1159/000489674
URL
[本文引用: 1]
Pancreatic cystic lesions are being detected with increasing frequency because of increased use and improved quality of cross-sectional imaging techniques. Pancreatic cystic lesions encompass non-neoplastic lesions (such as pancreatitis-related collections) and neoplastic tumors. Common cystic pancreatic neoplasms include serous cystadenomas, mucinous cystic neoplasms, intraductal papillary mucinous neoplasms, and solid pseudopapillary tumors. These cystic pancreatic neoplasms may have typical morphology, but at times show overlapping imaging features on cross-sectional examinations. This article reviews the classical and atypical imaging features of commonly encountered cystic pancreatic neoplasms and presents the limitations of current cross-sectional imaging techniques in accurately classifying pancreatic cystic lesions.
[6]
陈海燕 . 影像学特征联合增强CT纹理特征鉴别胰腺浆液性囊腺瘤与黏液性囊腺瘤 [D]. 浙江大学 , 2020 .
[本文引用: 2]
[7]
袁梦依 . 基于影像组学特征融合的胰腺囊性肿瘤分类 [D]. 浙江工业大学 , 2020 .
[本文引用: 5]
[8]
ZHANG Y F XU S S WU J , et al . Value of CT texture analysis in differentiating pancreatic serous cystadenoma from mucinous cystadenoma
[J]. Journal of Southeast University (Medical Science Edition) , 2022 , 41 (3 ): 308 -316 .
[本文引用: 4]
张怡帆 , 徐珊珊 , 吴锦 , 等 . CT纹理分析在鉴别胰腺浆液性囊腺瘤与黏液性囊腺瘤中的价值
[J]. 东南大学学报(医学版) , 2022 , 41 (3 ): 308 -316 .
[本文引用: 4]
[9]
CHEN S CHEN X CHEN J Y , et al . Application of CT radiomics in differential diagnosis of pancreatic serous and mucinous cystic neoplasm
[J]. Chinese Journal of CT and MRI , 2022 , 20 (10 ): 92 -95 .
[本文引用: 4]
陈帅 , 陈晓 , 陈井亚 , 等 . 基于CT影像组学对胰腺浆液及黏液性囊性肿瘤鉴别诊断
[J]. 中国CT和MRI杂志 , 2022 , 20 (10 ): 92 -95 .
[本文引用: 4]
[10]
YANG Y F QI Z X NIE S D . Differentiation of benign and malignant breast lesions based on multimodal MRI and deep learning
[J]. Chinese J Magn Reson , 2022 , 39 (4 ): 401 -412 .
[本文引用: 2]
杨一风 , 祁章璇 , 聂生东 . 基于多模态MRI与深度学习的乳腺病变良恶性鉴别
[J]. 波谱学杂志 , 2022 , 39 (4 ): 401 -412 .
[本文引用: 2]
[11]
WEI Z H YAN S J HAN B S , et al . Diagnosis of alzheimer's disease based on multi-output three-dimensional convolutional neural network
[J]. Chinese J Magn Reson , 2021 , 38 (1 ): 92 -100 .
[本文引用: 1]
魏志宏 , 闫士举 , 韩宝三 , 等 . 基于多输出的3D卷积神经网络诊断阿尔兹海默病
[J]. 波谱学杂志 , 2021 , 38 (1 ): 92 -100 .
[本文引用: 1]
[12]
NGUON L S SEO K LIM J H , et al . Deep learning-based differentiation between mucinous cystic neoplasm and serous cystic neoplasm in the pancreas using endoscopic ultrasonography
[J]. Diagnostics , 2021 , 11 (6 ): 1052 .
DOI:10.3390/diagnostics11061052
URL
[本文引用: 3]
Mucinous cystic neoplasms (MCN) and serous cystic neoplasms (SCN) account for a large portion of solitary pancreatic cystic neoplasms (PCN). In this study we implemented a convolutional neural network (CNN) model using ResNet50 to differentiate between MCN and SCN. The training data were collected retrospectively from 59 MCN and 49 SCN patients from two different hospitals. Data augmentation was used to enhance the size and quality of training datasets. Fine-tuning training approaches were utilized by adopting the pre-trained model from transfer learning while training selected layers. Testing of the network was conducted by varying the endoscopic ultrasonography (EUS) image sizes and positions to evaluate the network performance for differentiation. The proposed network model achieved up to 0.827 5 accuracy and a 0.88 (95% CI: 0.817–0.930) area under curve (AUC) score. The performance of the implemented deep learning networks in decision-making using only EUS images is comparable to that of traditional manual decision-making using EUS images along with supporting clinical information. Gradient-weighted class activation mapping (Grad-CAM) confirmed that the network model learned the features from the cyst region accurately. This study proves the feasibility of diagnosing MCN and SCN using a deep learning network model. Further improvement using more datasets is needed.
[13]
VILAS-BOAS F RIBEIRO T AFONSO J , et al . Deep learning for automatic differentiation of mucinous versus non-mucinous pancreatic cystic lesions: a pilot study
[J]. Diagnostics , 2022 , 12 (9 ): 2041 .
DOI:10.3390/diagnostics12092041
URL
[本文引用: 1]
Endoscopic ultrasound (EUS) morphology can aid in the discrimination between mucinous and non-mucinous pancreatic cystic lesions (PCLs) but has several limitations that can be overcome by artificial intelligence. We developed a convolutional neural network (CNN) algorithm for the automatic diagnosis of mucinous PCLs. Images retrieved from videos of EUS examinations for PCL characterization were used for the development, training, and validation of a CNN for mucinous cyst diagnosis. The performance of the CNN was measured calculating the area under the receiving operator characteristic curve (AUC), sensitivity, specificity, and positive and negative predictive values. A total of 5505 images from 28 pancreatic cysts were used (3725 from mucinous lesions and 1780 from non-mucinous cysts). The model had an overall accuracy of 98.5%, sensitivity of 98.3%, specificity of 98.9% and AUC of 1. The image processing speed of the CNN was 7.2 ms per frame. We developed a deep learning algorithm that differentiated mucinous and non-mucinous cysts with high accuracy. The present CNN may constitute an important tool to help risk stratify PCLs.
[14]
HUANG G LIU Z VAN DER MAATEN L , et al . Densely connected convolutional networks
[C]// Proceedings of the IEEE conference on computer vision and pattern recognition , 2017 : 4700 -4708 .
[本文引用: 2]
[15]
ZHOU Q ZHOU Z CHEN C , et al . Grading of hepatocellular carcinoma using 3D SE-DenseNet in dynamic enhanced MR images
[J]. Comput Biol Med , 2019 , 107 : 47 -57 .
DOI:S0010-4825(19)30032-0
PMID:30776671
[本文引用: 1]
Clinical histological grading of hepatocellular carcinoma (HCC) differentiation is of great significance in clinical diagnoses, treatments, and prognoses. However, it is challenging for radiologists to evaluate HCC gradings from medical images.In this study, a novel deep neural network was developed by combining the squeeze-and-excitation networks (SENets) in a three-dimensional (3D) densely connected convolutional network (DenseNet), which is referred to as a 3D SE-DenseNet, for the classification of HCC grading using enhanced clinical magnetic resonance (MR) images obtained from two different clinical centers.In the proposed architecture, the SENet was added as an additional layer between the dense blocks of the 3D DenseNet, to mitigate the impact of feature redundancy. For the HCC grading task, the 3D SE-DenseNet was trained after data augmentation, and it outperformed the 3D DenseNet based on the clinical dataset.The quantitative evaluations of the 3D SE-DenseNet on a two-class HCC grading task were conducted based on the dataset, which included 213 samples of the dynamic enhanced MR images. The proposed 3D SE-DenseNet demonstrated an accuracy of 83%, when compared with the 72% accuracy of the 3D DenseNet.Owing to the advantage of useful automatic feature learning by the SE layer, the 3D SE-DenseNet can simultaneously handle useful feature enhancement and superfluous feature suppression. The quantitative experiments confirm the excellent performance of the 3D SE-DenseNet in the evaluation of the HCC grading.Copyright © 2019 Elsevier Ltd. All rights reserved.
[16]
WANG Z LI X YAO M , et al . A new detection model of microaneurysms based on improved FC-DenseNet
[J]. Sci Rep , 2022 , 12 (1 ): 1 -9 .
DOI:10.1038/s41598-021-99269-x
[本文引用: 1]
The work mainly focused on a validation of the method for determining the content of salicylic acid and individual unknown impurities in new pharmaceutical product—tablets containing: 75, 100 or 150 mg of acetylsalicylic acid and glycine in the amount of 40 mg for each dosage. The separation of the components was carried out by means of HPLC, using a Waters Symmetry C18 column (4.6 × 250 mm, 5 μm) as the stationary phase. The mobile phase consisted of a mixture of 85% orthophosphoric acid, acetonitrile and purified water (2:400:600 V/V/V). Detection was carried out at a wavelength of 237 nm, with a constant flow rate of 1.0 ml min−1. In order to verify the method, linearity, precision (repeatability and reproducibility), accuracy, specificity, range, robustness, system precision, stability of the test and standard solution, limit of quantification and forced degradation were determined. Validation tests were performed in accordance with ICH (International Conference on Harmonisation of Technical Requirements for Registration of Pharmaceuticals for Human Use) guidelines. The method was validated successfully. It was confirmed that the method in a tested range of 0.005–0.40% salicylic acid with respect to acetylsalicylic acid content is linear, precise and accurate.
[17]
GUO W XU Z ZHANG H . Interstitial lung disease classification using improved DenseNet
[J]. Multimed Tools Appl , 2019 , 78 (21 ): 30615 -30626 .
DOI:10.1007/s11042-018-6535-y
[本文引用: 2]
Interstitial Lung Disease (ILD) is one of the popular respiratory diseases. The correct diagnosis of ILD is beneficial to improve the effect of treatment for patients. This paper presents an improved DenseNet called small kernel DenseNet (SK-DenseNet) to improve ILD classification performance. According to the characteristics of HRCT features of lung disease, the SK-DenseNet network is more effective to extract high level and small pathological features for ILD classification. Our experiment results show that the proposed SK-DenseNet obtains an outstanding performance (98.4%),which improves 5% performance compared with DenseNet. A comparative analysis with other CNNs, such as AlexNet, VGGNet, ResNet has also demonstrated that the effectiveness of SK-DenseNet in terms of classifying lung disease patterns is superior than those compared ones. The research has validated that using small convolution kernel is useful to improve the recognition efficiency when feature patterns are small.
[18]
YANG Y H LIU M WANG X M , et al . Breast cancer image recognition based on DenseNet and transfer learning
[J]. Journal of Jilin University , 2022 , 40 (2 ): 213 -218 .
[本文引用: 1]
杨雨航 , 刘铭 , 王新民 , 等 . 基于DenseNet和迁移学习的乳腺癌图像识别
[J]. 吉林大学学报 , 2022 , 40 (2 ): 213 -218 .
[本文引用: 1]
[19]
ZHOU Y ZHANG X WANG Y , et al . Transfer learning and its application research
[J]. J Phys: Conf Ser , 2021 , 1920 (1 ): 012058 .
DOI:10.1088/1742-6596/1920/1/012058
[本文引用: 1]
Transfer learning relaxes the assumption’s limitation requirements of the independent and identical distribution of training data and test data in machine learning. It aims to help the target domain complete the learning task by learning one or more source domains similar to the target domain, solve the problem of scarcity of annotation data and enhance the model’s robustness and generalization performance. The article is a survey on the progress of transfer learning. According to “how to transfer”, transfer learning is divided into four categories: instance-based transfer learning, feature-based transfer learning, model-based transfer learning, and relation-based transfer learning. The paper introduces the basic assumptions, main research questions, common methods, related research of various transfer learning algorithms, and the application of the transfer learning. Finally, we try to point out future research trends.
[20]
LI Y SONG P H . Review of transfer learning in medical image classification
[J]. Journal of Image and Graphics , 2022 , 27 (3 ): 672 -686 .
[本文引用: 1]
黎英 , 宋佩华 . 迁移学习在医学图像分类中的研究进展
[J]. 中国图象图形学报 , 2022 , 27 (3 ): 672 -686 .
[本文引用: 1]
[21]
KINGMA D P BA J . Adam: A method for stochastic optimization
[J]. arXiv preprint arXiv:1412.6980 , 2014 .
[本文引用: 1]
[22]
ZEILER M D . Adadelta: an adaptive learning rate method
[J]. arXiv preprint arXiv:1212.5701 , 2012 .
[本文引用: 1]
[23]
DUCHI J HAZAN E SINGER Y . Adaptive subgradient methods for online learning and stochastic optimization
[J]. J Mach Learn Res , 2011 , 12 (7 ): 2121 -2159 .
[本文引用: 1]
[24]
DEAN J CORADO G MONGA R , et al . Large scale distributed deep networks
[J]. Adv Neural Inf Process Syst , 2012 , 25 : 1 -11 .
[本文引用: 1]
Recent advances in the diagnostic evaluation of pancreatic cystic lesions
2
2022
... 胰腺是人体重要的组织器官之一,根据数据显示,胰腺囊性肿瘤(pancreatic cystic neoplasms,PCNs)在一般人群中的发病率大约在4%~14%,并且还在不断升高[1 ] .PCNs主要包括四种类型:胰腺导管内乳头状黏液肿瘤(IPMN)、实性假乳头状瘤(SPN)、浆液性囊性肿瘤(SCN)和黏液性囊性肿瘤(MCN).其中SCN和MCN是最常见的胰腺囊性肿瘤,SCN属于良性肿瘤,一般以随访为主,出现临床症状后再考虑手术切除,而MCN具有恶变潜能,生长较快,有癌变的风险[2 ] .有文献[3 ] 统计,目前对于胰腺囊性肿瘤的术前诊断准确率仅有60%~70%,很多患者进行了不必要的手术,而相关手术通常有20%~40%的复发率和大约2%的死亡率[1 ] ,因此SCN和MCN的鉴别诊断对于选择合适的治疗方案有着重要的临床意义. ...
... [1 ],因此SCN和MCN的鉴别诊断对于选择合适的治疗方案有着重要的临床意义. ...
胰腺囊性肿瘤的诊治进展
1
2020
... 胰腺是人体重要的组织器官之一,根据数据显示,胰腺囊性肿瘤(pancreatic cystic neoplasms,PCNs)在一般人群中的发病率大约在4%~14%,并且还在不断升高[1 ] .PCNs主要包括四种类型:胰腺导管内乳头状黏液肿瘤(IPMN)、实性假乳头状瘤(SPN)、浆液性囊性肿瘤(SCN)和黏液性囊性肿瘤(MCN).其中SCN和MCN是最常见的胰腺囊性肿瘤,SCN属于良性肿瘤,一般以随访为主,出现临床症状后再考虑手术切除,而MCN具有恶变潜能,生长较快,有癌变的风险[2 ] .有文献[3 ] 统计,目前对于胰腺囊性肿瘤的术前诊断准确率仅有60%~70%,很多患者进行了不必要的手术,而相关手术通常有20%~40%的复发率和大约2%的死亡率[1 ] ,因此SCN和MCN的鉴别诊断对于选择合适的治疗方案有着重要的临床意义. ...
Preoperative diagnosis of pancreatic cystic lesions: the accuracy of endoscopic ultrasound and cross-sectional imaging
1
2015
... 胰腺是人体重要的组织器官之一,根据数据显示,胰腺囊性肿瘤(pancreatic cystic neoplasms,PCNs)在一般人群中的发病率大约在4%~14%,并且还在不断升高[1 ] .PCNs主要包括四种类型:胰腺导管内乳头状黏液肿瘤(IPMN)、实性假乳头状瘤(SPN)、浆液性囊性肿瘤(SCN)和黏液性囊性肿瘤(MCN).其中SCN和MCN是最常见的胰腺囊性肿瘤,SCN属于良性肿瘤,一般以随访为主,出现临床症状后再考虑手术切除,而MCN具有恶变潜能,生长较快,有癌变的风险[2 ] .有文献[3 ] 统计,目前对于胰腺囊性肿瘤的术前诊断准确率仅有60%~70%,很多患者进行了不必要的手术,而相关手术通常有20%~40%的复发率和大约2%的死亡率[1 ] ,因此SCN和MCN的鉴别诊断对于选择合适的治疗方案有着重要的临床意义. ...
Comparative diagnostic evaluation with contrast-enhanced ultrasound, computed tomography and magnetic resonance imaging in patients with pancreatic cystic neoplasms
1
2020
... 目前,对于胰腺囊性肿瘤的诊断方式有超声、CT、MRI等[4 ] .SCN的典型表现为微囊型及蜂窝型,边界清楚,在MRI中T 1 加权像呈低信号,在T 2 加权像呈高信号.MCN大多直径较大,多发于胰腺体尾部,其MRI成像特征为:清亮囊内容物在T 1 加权像呈低信号,胶冻样囊内容物呈高信号,信号强度可能随囊内容物含量而变化,在T 2 加权像呈现出相间的形式[5 ] .目前MRI诊断胰腺囊性肿瘤的准确率在40%~95%之间[6 ] ,相对来说还较低.然而SCN中表现为典型结构的仅占全部的30%[6 ] ,其余SCN形态各异,其中表现为较大单囊结构的SCN在外观形态上与MCN无差异,因此经常被误诊为MCN,导致其人工分类时准确率不高. ...
Radiological workup of cystic neoplasms of the pancreas
1
2018
... 目前,对于胰腺囊性肿瘤的诊断方式有超声、CT、MRI等[4 ] .SCN的典型表现为微囊型及蜂窝型,边界清楚,在MRI中T 1 加权像呈低信号,在T 2 加权像呈高信号.MCN大多直径较大,多发于胰腺体尾部,其MRI成像特征为:清亮囊内容物在T 1 加权像呈低信号,胶冻样囊内容物呈高信号,信号强度可能随囊内容物含量而变化,在T 2 加权像呈现出相间的形式[5 ] .目前MRI诊断胰腺囊性肿瘤的准确率在40%~95%之间[6 ] ,相对来说还较低.然而SCN中表现为典型结构的仅占全部的30%[6 ] ,其余SCN形态各异,其中表现为较大单囊结构的SCN在外观形态上与MCN无差异,因此经常被误诊为MCN,导致其人工分类时准确率不高. ...
2
2020
... 目前,对于胰腺囊性肿瘤的诊断方式有超声、CT、MRI等[4 ] .SCN的典型表现为微囊型及蜂窝型,边界清楚,在MRI中T 1 加权像呈低信号,在T 2 加权像呈高信号.MCN大多直径较大,多发于胰腺体尾部,其MRI成像特征为:清亮囊内容物在T 1 加权像呈低信号,胶冻样囊内容物呈高信号,信号强度可能随囊内容物含量而变化,在T 2 加权像呈现出相间的形式[5 ] .目前MRI诊断胰腺囊性肿瘤的准确率在40%~95%之间[6 ] ,相对来说还较低.然而SCN中表现为典型结构的仅占全部的30%[6 ] ,其余SCN形态各异,其中表现为较大单囊结构的SCN在外观形态上与MCN无差异,因此经常被误诊为MCN,导致其人工分类时准确率不高. ...
... [6 ],其余SCN形态各异,其中表现为较大单囊结构的SCN在外观形态上与MCN无差异,因此经常被误诊为MCN,导致其人工分类时准确率不高. ...
5
2020
... 近年来对于胰腺囊性肿瘤的识别诊断得到了部分学者的关注和研究,对于胰腺囊性肿瘤的发现和治疗起到了积极作用.Yuan等[7 ] 提出了一种基于不相似度的影像组学特征融合的胰腺囊性肿瘤分类方法,对MCN和SCN的CT图像进行分类,准确率达0.862,有效提高了胰腺囊性肿瘤分类的准确率.Zhang等[8 ] 回顾分析46例SCN和29例MCN患者术前CT静脉期图像,构建临床影像学特征模型、CT纹理特征模型以及两者的综合模型,其中临床影像学特征模型AUC值为0.814,CT纹理特征模型AUC值为0.866,两者综合模型的ROC曲线下面积(AUC值)达到了0.938,证明了CT纹理分析有助于SCN和MCN的鉴别诊断.Chen等[9 ] 基于CT影像组学方法,建立6种机器学习模型,对37例SCN患者和28例MCN患者的CT图像进行训练和验证,其中人工神经网络模型表现最佳,准确率达0.895,AUC值为0.92. ...
... 为了验证本文方案的可行性,将本文方法与其他深度学习模型AlexNet、MobileNet_v3、Vgg16以及ResNet50应用于MCN和SCN识别的性能进行比较,这些深度模型均是常用于图像分类任务中的模型,其中ResNet50已被应用于MCN与SCN的鉴别诊断中[7 ] .对比实验结果如表4 所示,图2 和图3 为不同模型的ROC曲线和混淆矩阵. ...
... Results of MCN and SCN recognition by different methods
Table 5 方法 数据 ACC 文献[7 ] 影像组学特征融合 胰腺囊性肿瘤CT图像 0.862 文献[8 ] CT纹理特征模型+临床影像学特征模型 SCN与MCN静脉期CT图像 0.938 (AUC) 文献[9 ] 影像组学参数+人工神经网络 SCN与MCN CT图像 0.895 文献[12 ] ResNet50+迁移学习 SCN与MCN内窥镜超声图像 0.828 本文 DenseNet161+迁移学习 SCN与MCN T 2 加权MR图像 0.943
由表5 看出,文献[7 ]、文献[8 ]、文献[9 ]均是基于影像组学的方法,提取不同的影像组学特征对MCN和SCN进行识别分类,并且使用的数据都是胰腺囊性肿瘤的CT图像,文献[7 ]、文献[9 ]准确率分别为0.862、0.895,文献[8 ]的AUC值达到0.938,证明影像组学特征对于胰腺囊性肿瘤的识别分类有良好的效果,但其准确率还有待提高.文献[12 ]是基于深度学习的方法对MCN与SCN的内窥镜超声图像进行分类,对Resnet50结合迁移学习的模型进行微调,AUC达到0.88,证明了深度学习对胰腺囊性肿瘤进行鉴别诊断的可行性,但其准确率并不是很高,仅有0.828,其原因与内窥镜的扫描条件有关,内窥镜超声图像与成像目标的表面距离不同,且其成像为动态图像,因此较难选取合适的成像帧,会对后续的实验造成一定影响.而本文基于DenseNet161和迁移学习的模型对SCN和MCN的MR图像分类准确率达到了0.943,AUC值达到了0.989,高于以上所有方法,证明该模型学习到了图像中更深层次的特征,有较强的学习能力,对MCN和SCN有较好的分类效果. ...
... 由表5 看出,文献[7 ]、文献[8 ]、文献[9 ]均是基于影像组学的方法,提取不同的影像组学特征对MCN和SCN进行识别分类,并且使用的数据都是胰腺囊性肿瘤的CT图像,文献[7 ]、文献[9 ]准确率分别为0.862、0.895,文献[8 ]的AUC值达到0.938,证明影像组学特征对于胰腺囊性肿瘤的识别分类有良好的效果,但其准确率还有待提高.文献[12 ]是基于深度学习的方法对MCN与SCN的内窥镜超声图像进行分类,对Resnet50结合迁移学习的模型进行微调,AUC达到0.88,证明了深度学习对胰腺囊性肿瘤进行鉴别诊断的可行性,但其准确率并不是很高,仅有0.828,其原因与内窥镜的扫描条件有关,内窥镜超声图像与成像目标的表面距离不同,且其成像为动态图像,因此较难选取合适的成像帧,会对后续的实验造成一定影响.而本文基于DenseNet161和迁移学习的模型对SCN和MCN的MR图像分类准确率达到了0.943,AUC值达到了0.989,高于以上所有方法,证明该模型学习到了图像中更深层次的特征,有较强的学习能力,对MCN和SCN有较好的分类效果. ...
... ]均是基于影像组学的方法,提取不同的影像组学特征对MCN和SCN进行识别分类,并且使用的数据都是胰腺囊性肿瘤的CT图像,文献[7 ]、文献[9 ]准确率分别为0.862、0.895,文献[8 ]的AUC值达到0.938,证明影像组学特征对于胰腺囊性肿瘤的识别分类有良好的效果,但其准确率还有待提高.文献[12 ]是基于深度学习的方法对MCN与SCN的内窥镜超声图像进行分类,对Resnet50结合迁移学习的模型进行微调,AUC达到0.88,证明了深度学习对胰腺囊性肿瘤进行鉴别诊断的可行性,但其准确率并不是很高,仅有0.828,其原因与内窥镜的扫描条件有关,内窥镜超声图像与成像目标的表面距离不同,且其成像为动态图像,因此较难选取合适的成像帧,会对后续的实验造成一定影响.而本文基于DenseNet161和迁移学习的模型对SCN和MCN的MR图像分类准确率达到了0.943,AUC值达到了0.989,高于以上所有方法,证明该模型学习到了图像中更深层次的特征,有较强的学习能力,对MCN和SCN有较好的分类效果. ...
CT纹理分析在鉴别胰腺浆液性囊腺瘤与黏液性囊腺瘤中的价值
4
2022
... 近年来对于胰腺囊性肿瘤的识别诊断得到了部分学者的关注和研究,对于胰腺囊性肿瘤的发现和治疗起到了积极作用.Yuan等[7 ] 提出了一种基于不相似度的影像组学特征融合的胰腺囊性肿瘤分类方法,对MCN和SCN的CT图像进行分类,准确率达0.862,有效提高了胰腺囊性肿瘤分类的准确率.Zhang等[8 ] 回顾分析46例SCN和29例MCN患者术前CT静脉期图像,构建临床影像学特征模型、CT纹理特征模型以及两者的综合模型,其中临床影像学特征模型AUC值为0.814,CT纹理特征模型AUC值为0.866,两者综合模型的ROC曲线下面积(AUC值)达到了0.938,证明了CT纹理分析有助于SCN和MCN的鉴别诊断.Chen等[9 ] 基于CT影像组学方法,建立6种机器学习模型,对37例SCN患者和28例MCN患者的CT图像进行训练和验证,其中人工神经网络模型表现最佳,准确率达0.895,AUC值为0.92. ...
... Results of MCN and SCN recognition by different methods
Table 5 方法 数据 ACC 文献[7 ] 影像组学特征融合 胰腺囊性肿瘤CT图像 0.862 文献[8 ] CT纹理特征模型+临床影像学特征模型 SCN与MCN静脉期CT图像 0.938 (AUC) 文献[9 ] 影像组学参数+人工神经网络 SCN与MCN CT图像 0.895 文献[12 ] ResNet50+迁移学习 SCN与MCN内窥镜超声图像 0.828 本文 DenseNet161+迁移学习 SCN与MCN T 2 加权MR图像 0.943
由表5 看出,文献[7 ]、文献[8 ]、文献[9 ]均是基于影像组学的方法,提取不同的影像组学特征对MCN和SCN进行识别分类,并且使用的数据都是胰腺囊性肿瘤的CT图像,文献[7 ]、文献[9 ]准确率分别为0.862、0.895,文献[8 ]的AUC值达到0.938,证明影像组学特征对于胰腺囊性肿瘤的识别分类有良好的效果,但其准确率还有待提高.文献[12 ]是基于深度学习的方法对MCN与SCN的内窥镜超声图像进行分类,对Resnet50结合迁移学习的模型进行微调,AUC达到0.88,证明了深度学习对胰腺囊性肿瘤进行鉴别诊断的可行性,但其准确率并不是很高,仅有0.828,其原因与内窥镜的扫描条件有关,内窥镜超声图像与成像目标的表面距离不同,且其成像为动态图像,因此较难选取合适的成像帧,会对后续的实验造成一定影响.而本文基于DenseNet161和迁移学习的模型对SCN和MCN的MR图像分类准确率达到了0.943,AUC值达到了0.989,高于以上所有方法,证明该模型学习到了图像中更深层次的特征,有较强的学习能力,对MCN和SCN有较好的分类效果. ...
... 由表5 看出,文献[7 ]、文献[8 ]、文献[9 ]均是基于影像组学的方法,提取不同的影像组学特征对MCN和SCN进行识别分类,并且使用的数据都是胰腺囊性肿瘤的CT图像,文献[7 ]、文献[9 ]准确率分别为0.862、0.895,文献[8 ]的AUC值达到0.938,证明影像组学特征对于胰腺囊性肿瘤的识别分类有良好的效果,但其准确率还有待提高.文献[12 ]是基于深度学习的方法对MCN与SCN的内窥镜超声图像进行分类,对Resnet50结合迁移学习的模型进行微调,AUC达到0.88,证明了深度学习对胰腺囊性肿瘤进行鉴别诊断的可行性,但其准确率并不是很高,仅有0.828,其原因与内窥镜的扫描条件有关,内窥镜超声图像与成像目标的表面距离不同,且其成像为动态图像,因此较难选取合适的成像帧,会对后续的实验造成一定影响.而本文基于DenseNet161和迁移学习的模型对SCN和MCN的MR图像分类准确率达到了0.943,AUC值达到了0.989,高于以上所有方法,证明该模型学习到了图像中更深层次的特征,有较强的学习能力,对MCN和SCN有较好的分类效果. ...
... ]准确率分别为0.862、0.895,文献[8 ]的AUC值达到0.938,证明影像组学特征对于胰腺囊性肿瘤的识别分类有良好的效果,但其准确率还有待提高.文献[12 ]是基于深度学习的方法对MCN与SCN的内窥镜超声图像进行分类,对Resnet50结合迁移学习的模型进行微调,AUC达到0.88,证明了深度学习对胰腺囊性肿瘤进行鉴别诊断的可行性,但其准确率并不是很高,仅有0.828,其原因与内窥镜的扫描条件有关,内窥镜超声图像与成像目标的表面距离不同,且其成像为动态图像,因此较难选取合适的成像帧,会对后续的实验造成一定影响.而本文基于DenseNet161和迁移学习的模型对SCN和MCN的MR图像分类准确率达到了0.943,AUC值达到了0.989,高于以上所有方法,证明该模型学习到了图像中更深层次的特征,有较强的学习能力,对MCN和SCN有较好的分类效果. ...
基于CT影像组学对胰腺浆液及黏液性囊性肿瘤鉴别诊断
4
2022
... 近年来对于胰腺囊性肿瘤的识别诊断得到了部分学者的关注和研究,对于胰腺囊性肿瘤的发现和治疗起到了积极作用.Yuan等[7 ] 提出了一种基于不相似度的影像组学特征融合的胰腺囊性肿瘤分类方法,对MCN和SCN的CT图像进行分类,准确率达0.862,有效提高了胰腺囊性肿瘤分类的准确率.Zhang等[8 ] 回顾分析46例SCN和29例MCN患者术前CT静脉期图像,构建临床影像学特征模型、CT纹理特征模型以及两者的综合模型,其中临床影像学特征模型AUC值为0.814,CT纹理特征模型AUC值为0.866,两者综合模型的ROC曲线下面积(AUC值)达到了0.938,证明了CT纹理分析有助于SCN和MCN的鉴别诊断.Chen等[9 ] 基于CT影像组学方法,建立6种机器学习模型,对37例SCN患者和28例MCN患者的CT图像进行训练和验证,其中人工神经网络模型表现最佳,准确率达0.895,AUC值为0.92. ...
... Results of MCN and SCN recognition by different methods
Table 5 方法 数据 ACC 文献[7 ] 影像组学特征融合 胰腺囊性肿瘤CT图像 0.862 文献[8 ] CT纹理特征模型+临床影像学特征模型 SCN与MCN静脉期CT图像 0.938 (AUC) 文献[9 ] 影像组学参数+人工神经网络 SCN与MCN CT图像 0.895 文献[12 ] ResNet50+迁移学习 SCN与MCN内窥镜超声图像 0.828 本文 DenseNet161+迁移学习 SCN与MCN T 2 加权MR图像 0.943
由表5 看出,文献[7 ]、文献[8 ]、文献[9 ]均是基于影像组学的方法,提取不同的影像组学特征对MCN和SCN进行识别分类,并且使用的数据都是胰腺囊性肿瘤的CT图像,文献[7 ]、文献[9 ]准确率分别为0.862、0.895,文献[8 ]的AUC值达到0.938,证明影像组学特征对于胰腺囊性肿瘤的识别分类有良好的效果,但其准确率还有待提高.文献[12 ]是基于深度学习的方法对MCN与SCN的内窥镜超声图像进行分类,对Resnet50结合迁移学习的模型进行微调,AUC达到0.88,证明了深度学习对胰腺囊性肿瘤进行鉴别诊断的可行性,但其准确率并不是很高,仅有0.828,其原因与内窥镜的扫描条件有关,内窥镜超声图像与成像目标的表面距离不同,且其成像为动态图像,因此较难选取合适的成像帧,会对后续的实验造成一定影响.而本文基于DenseNet161和迁移学习的模型对SCN和MCN的MR图像分类准确率达到了0.943,AUC值达到了0.989,高于以上所有方法,证明该模型学习到了图像中更深层次的特征,有较强的学习能力,对MCN和SCN有较好的分类效果. ...
... 由表5 看出,文献[7 ]、文献[8 ]、文献[9 ]均是基于影像组学的方法,提取不同的影像组学特征对MCN和SCN进行识别分类,并且使用的数据都是胰腺囊性肿瘤的CT图像,文献[7 ]、文献[9 ]准确率分别为0.862、0.895,文献[8 ]的AUC值达到0.938,证明影像组学特征对于胰腺囊性肿瘤的识别分类有良好的效果,但其准确率还有待提高.文献[12 ]是基于深度学习的方法对MCN与SCN的内窥镜超声图像进行分类,对Resnet50结合迁移学习的模型进行微调,AUC达到0.88,证明了深度学习对胰腺囊性肿瘤进行鉴别诊断的可行性,但其准确率并不是很高,仅有0.828,其原因与内窥镜的扫描条件有关,内窥镜超声图像与成像目标的表面距离不同,且其成像为动态图像,因此较难选取合适的成像帧,会对后续的实验造成一定影响.而本文基于DenseNet161和迁移学习的模型对SCN和MCN的MR图像分类准确率达到了0.943,AUC值达到了0.989,高于以上所有方法,证明该模型学习到了图像中更深层次的特征,有较强的学习能力,对MCN和SCN有较好的分类效果. ...
... ]、文献[9 ]准确率分别为0.862、0.895,文献[8 ]的AUC值达到0.938,证明影像组学特征对于胰腺囊性肿瘤的识别分类有良好的效果,但其准确率还有待提高.文献[12 ]是基于深度学习的方法对MCN与SCN的内窥镜超声图像进行分类,对Resnet50结合迁移学习的模型进行微调,AUC达到0.88,证明了深度学习对胰腺囊性肿瘤进行鉴别诊断的可行性,但其准确率并不是很高,仅有0.828,其原因与内窥镜的扫描条件有关,内窥镜超声图像与成像目标的表面距离不同,且其成像为动态图像,因此较难选取合适的成像帧,会对后续的实验造成一定影响.而本文基于DenseNet161和迁移学习的模型对SCN和MCN的MR图像分类准确率达到了0.943,AUC值达到了0.989,高于以上所有方法,证明该模型学习到了图像中更深层次的特征,有较强的学习能力,对MCN和SCN有较好的分类效果. ...
基于多模态MRI与深度学习的乳腺病变良恶性鉴别
2
2022
... 以上学者主要都是基于影像组学的方法对胰腺囊性肿瘤进行识别分类,而近年来随着计算机技术的快速发展,基于深度学习的医学图像分类应用越来越广泛[10 ,11 ] ,也达到了不错的效果.深度学习在输入层与输出层之间使用隐藏层来对数据的中间表征建模,能够使计算机自动地从图像中获得更深层次和更抽象的特征,有效排除人为因素的影响,易于实现全自动化,可以节省时间和精力,能够有效提高MCN和SCN的诊断精确度.深度学习一般需要大量的数据进行训练,在处理医学图像分类问题时,由于临床数据量较小,模型容易过拟合,而迁移学习一定程度上可以解决这一问题并且提高学习效率,使得模型初始性能更高,在深度学习分类任务中发挥了重要作用.Nguon等[12 ] 使用卷积神经网络ResNet50和迁移学习来区分MCN和SCN,通过改变内窥镜超声(EUS)图像的大小和位置来评估网络的区分性能,微调后准确率达到0.827 5,AUC值为0.88.Vilas-Boas[13 ] 等人针对胰腺囊肿的内窥镜超声图像,提出一种卷积神经网络算法,区分黏液性和非黏液性胰腺囊性病变,其中前者包括IPMN和MCN,后者包括SCN及假性囊性病变,该模型总体准确率达到0.985. ...
... 但本研究还存在一定局限性:深度学习需要尽可能多的数据集,本文患者数量相对较少,数据量还不够充足,未来可能需要更大的数据集,这对模型的优化有更重要的意义.现已有研究表明融合多模态特征进行医学图像分类的优越性[10 ] ,本文使用单模态数据进行实验,一是表5 中的其他方法均使用单模态数据,便于与其对比,二是本文重点在于深度学习模型的选择以及构建,后续研究将融合SCN和MCN的多模态数据,进一步提升模型性能.综上所述,本研究基于DenseNet161结合迁移学习对于SCN和MCN有较好的诊断性能,提高了胰腺囊性肿瘤诊断的精确度,证明了该模型在胰腺囊性肿瘤MR图像识别中具有较大优势和重要的临床意义,后续工作将继续致力于提高胰腺囊性肿瘤识别分类的准确性,并促进相关研究成果真正应用于临床,服务于广大患者. ...
基于多输出的3D卷积神经网络诊断阿尔兹海默病
1
2021
... 以上学者主要都是基于影像组学的方法对胰腺囊性肿瘤进行识别分类,而近年来随着计算机技术的快速发展,基于深度学习的医学图像分类应用越来越广泛[10 ,11 ] ,也达到了不错的效果.深度学习在输入层与输出层之间使用隐藏层来对数据的中间表征建模,能够使计算机自动地从图像中获得更深层次和更抽象的特征,有效排除人为因素的影响,易于实现全自动化,可以节省时间和精力,能够有效提高MCN和SCN的诊断精确度.深度学习一般需要大量的数据进行训练,在处理医学图像分类问题时,由于临床数据量较小,模型容易过拟合,而迁移学习一定程度上可以解决这一问题并且提高学习效率,使得模型初始性能更高,在深度学习分类任务中发挥了重要作用.Nguon等[12 ] 使用卷积神经网络ResNet50和迁移学习来区分MCN和SCN,通过改变内窥镜超声(EUS)图像的大小和位置来评估网络的区分性能,微调后准确率达到0.827 5,AUC值为0.88.Vilas-Boas[13 ] 等人针对胰腺囊肿的内窥镜超声图像,提出一种卷积神经网络算法,区分黏液性和非黏液性胰腺囊性病变,其中前者包括IPMN和MCN,后者包括SCN及假性囊性病变,该模型总体准确率达到0.985. ...
Deep learning-based differentiation between mucinous cystic neoplasm and serous cystic neoplasm in the pancreas using endoscopic ultrasonography
3
2021
... 以上学者主要都是基于影像组学的方法对胰腺囊性肿瘤进行识别分类,而近年来随着计算机技术的快速发展,基于深度学习的医学图像分类应用越来越广泛[10 ,11 ] ,也达到了不错的效果.深度学习在输入层与输出层之间使用隐藏层来对数据的中间表征建模,能够使计算机自动地从图像中获得更深层次和更抽象的特征,有效排除人为因素的影响,易于实现全自动化,可以节省时间和精力,能够有效提高MCN和SCN的诊断精确度.深度学习一般需要大量的数据进行训练,在处理医学图像分类问题时,由于临床数据量较小,模型容易过拟合,而迁移学习一定程度上可以解决这一问题并且提高学习效率,使得模型初始性能更高,在深度学习分类任务中发挥了重要作用.Nguon等[12 ] 使用卷积神经网络ResNet50和迁移学习来区分MCN和SCN,通过改变内窥镜超声(EUS)图像的大小和位置来评估网络的区分性能,微调后准确率达到0.827 5,AUC值为0.88.Vilas-Boas[13 ] 等人针对胰腺囊肿的内窥镜超声图像,提出一种卷积神经网络算法,区分黏液性和非黏液性胰腺囊性病变,其中前者包括IPMN和MCN,后者包括SCN及假性囊性病变,该模型总体准确率达到0.985. ...
... Results of MCN and SCN recognition by different methods
Table 5 方法 数据 ACC 文献[7 ] 影像组学特征融合 胰腺囊性肿瘤CT图像 0.862 文献[8 ] CT纹理特征模型+临床影像学特征模型 SCN与MCN静脉期CT图像 0.938 (AUC) 文献[9 ] 影像组学参数+人工神经网络 SCN与MCN CT图像 0.895 文献[12 ] ResNet50+迁移学习 SCN与MCN内窥镜超声图像 0.828 本文 DenseNet161+迁移学习 SCN与MCN T 2 加权MR图像 0.943
由表5 看出,文献[7 ]、文献[8 ]、文献[9 ]均是基于影像组学的方法,提取不同的影像组学特征对MCN和SCN进行识别分类,并且使用的数据都是胰腺囊性肿瘤的CT图像,文献[7 ]、文献[9 ]准确率分别为0.862、0.895,文献[8 ]的AUC值达到0.938,证明影像组学特征对于胰腺囊性肿瘤的识别分类有良好的效果,但其准确率还有待提高.文献[12 ]是基于深度学习的方法对MCN与SCN的内窥镜超声图像进行分类,对Resnet50结合迁移学习的模型进行微调,AUC达到0.88,证明了深度学习对胰腺囊性肿瘤进行鉴别诊断的可行性,但其准确率并不是很高,仅有0.828,其原因与内窥镜的扫描条件有关,内窥镜超声图像与成像目标的表面距离不同,且其成像为动态图像,因此较难选取合适的成像帧,会对后续的实验造成一定影响.而本文基于DenseNet161和迁移学习的模型对SCN和MCN的MR图像分类准确率达到了0.943,AUC值达到了0.989,高于以上所有方法,证明该模型学习到了图像中更深层次的特征,有较强的学习能力,对MCN和SCN有较好的分类效果. ...
... 由表5 看出,文献[7 ]、文献[8 ]、文献[9 ]均是基于影像组学的方法,提取不同的影像组学特征对MCN和SCN进行识别分类,并且使用的数据都是胰腺囊性肿瘤的CT图像,文献[7 ]、文献[9 ]准确率分别为0.862、0.895,文献[8 ]的AUC值达到0.938,证明影像组学特征对于胰腺囊性肿瘤的识别分类有良好的效果,但其准确率还有待提高.文献[12 ]是基于深度学习的方法对MCN与SCN的内窥镜超声图像进行分类,对Resnet50结合迁移学习的模型进行微调,AUC达到0.88,证明了深度学习对胰腺囊性肿瘤进行鉴别诊断的可行性,但其准确率并不是很高,仅有0.828,其原因与内窥镜的扫描条件有关,内窥镜超声图像与成像目标的表面距离不同,且其成像为动态图像,因此较难选取合适的成像帧,会对后续的实验造成一定影响.而本文基于DenseNet161和迁移学习的模型对SCN和MCN的MR图像分类准确率达到了0.943,AUC值达到了0.989,高于以上所有方法,证明该模型学习到了图像中更深层次的特征,有较强的学习能力,对MCN和SCN有较好的分类效果. ...
Deep learning for automatic differentiation of mucinous versus non-mucinous pancreatic cystic lesions: a pilot study
1
2022
... 以上学者主要都是基于影像组学的方法对胰腺囊性肿瘤进行识别分类,而近年来随着计算机技术的快速发展,基于深度学习的医学图像分类应用越来越广泛[10 ,11 ] ,也达到了不错的效果.深度学习在输入层与输出层之间使用隐藏层来对数据的中间表征建模,能够使计算机自动地从图像中获得更深层次和更抽象的特征,有效排除人为因素的影响,易于实现全自动化,可以节省时间和精力,能够有效提高MCN和SCN的诊断精确度.深度学习一般需要大量的数据进行训练,在处理医学图像分类问题时,由于临床数据量较小,模型容易过拟合,而迁移学习一定程度上可以解决这一问题并且提高学习效率,使得模型初始性能更高,在深度学习分类任务中发挥了重要作用.Nguon等[12 ] 使用卷积神经网络ResNet50和迁移学习来区分MCN和SCN,通过改变内窥镜超声(EUS)图像的大小和位置来评估网络的区分性能,微调后准确率达到0.827 5,AUC值为0.88.Vilas-Boas[13 ] 等人针对胰腺囊肿的内窥镜超声图像,提出一种卷积神经网络算法,区分黏液性和非黏液性胰腺囊性病变,其中前者包括IPMN和MCN,后者包括SCN及假性囊性病变,该模型总体准确率达到0.985. ...
Densely connected convolutional networks
2
2017
... DenseNet(Dense Convolutional Network)是Huang[14 ] 等在2017年提出的最佳深度学习网络,它不同于ResNet提升网络性能的方法,其核心思想是密集连接,建立不同层之间的连接关系,充分利用每一层的特征信息,提升网络的训练效果.DenseNet主要由多个密集块(Dense Block)和过渡层(Transition Layer)组成,Dense Block每一层都与前面所有层相连接,使用级联(Concatenation)方式,并保持每一层的特征图大小相同,相邻Dense Block之间由Transition Layer连接,通过批量归一化层、激活层、卷积层(Convolution)以及池化层(Pooling)实现降采样,使用1×1卷积减少通道数,通过池化以降低特征图大小,起到压缩模型的作用. ...
... 其中${{H}_{l}}(\cdot )$表示非线性转化函数,包括批量归一化、激活、卷积等操作.如果每个${{H}_{l}}(\cdot )$后输出k 个特征图,即得到的特征图通道数为k ,这个超参数k 在DenseNet中称为增长率(growth rate),一般情况下,使用较小的增长率(比如k = 12)可以使得网络变窄,减少参数,获得较佳的网络性能[14 ] .因此与其他卷积神经网络对比,DenseNet是一种隐式的强监督模式,通过加强每一层的输入,增强了特征在网络模型中的传播,实现了特征重用,并且每一层都可以直接访问来自损失函数和原始输入信号的梯度,提升了梯度的反向传播,使得网络更容易训练,既一定程度上减少了网络的参数量,又减轻了梯度消失的问题. ...
Grading of hepatocellular carcinoma using 3D SE-DenseNet in dynamic enhanced MR images
1
2019
... 由于DenseNet出色的性能,其密集连接块可以利用到更多深层次的特征,目前被广泛应用于医学图像分类任务中.Zhou等[15 ] 将3D DenseNet与SENet相结合,对两级肝细胞癌进行分级,准确率可达0.83,表现出了优异性能.Wang等[16 ] 提出一种基于改进的FC-DenseNet对微动脉瘤进行检测,结果表明,所提出的MAS-FC-DenseNet是一种快速、准确检测出微动脉瘤的可靠模型,可用于糖尿病视网膜病变的筛查.Guo等[17 ] 基于改进的DenseNet(SK-DenseNet)对间质性肺疾病进行分类诊断,最佳结果达到0.984. Yang等[18 ] 使用DenseNet结合迁移学习的方法对不同放大倍数的乳腺癌图像进行识别,其准确率达到了0.98以上.以上研究证明DenseNet在医学图像分类任务中表现出了良好的性能,拥有较强的特征提取能力,因此选用DenseNet网络对MCN和SCN进行分类,以解决临床上人工分类准确率不高的问题. ...
A new detection model of microaneurysms based on improved FC-DenseNet
1
2022
... 由于DenseNet出色的性能,其密集连接块可以利用到更多深层次的特征,目前被广泛应用于医学图像分类任务中.Zhou等[15 ] 将3D DenseNet与SENet相结合,对两级肝细胞癌进行分级,准确率可达0.83,表现出了优异性能.Wang等[16 ] 提出一种基于改进的FC-DenseNet对微动脉瘤进行检测,结果表明,所提出的MAS-FC-DenseNet是一种快速、准确检测出微动脉瘤的可靠模型,可用于糖尿病视网膜病变的筛查.Guo等[17 ] 基于改进的DenseNet(SK-DenseNet)对间质性肺疾病进行分类诊断,最佳结果达到0.984. Yang等[18 ] 使用DenseNet结合迁移学习的方法对不同放大倍数的乳腺癌图像进行识别,其准确率达到了0.98以上.以上研究证明DenseNet在医学图像分类任务中表现出了良好的性能,拥有较强的特征提取能力,因此选用DenseNet网络对MCN和SCN进行分类,以解决临床上人工分类准确率不高的问题. ...
Interstitial lung disease classification using improved DenseNet
2
2019
... 由于DenseNet出色的性能,其密集连接块可以利用到更多深层次的特征,目前被广泛应用于医学图像分类任务中.Zhou等[15 ] 将3D DenseNet与SENet相结合,对两级肝细胞癌进行分级,准确率可达0.83,表现出了优异性能.Wang等[16 ] 提出一种基于改进的FC-DenseNet对微动脉瘤进行检测,结果表明,所提出的MAS-FC-DenseNet是一种快速、准确检测出微动脉瘤的可靠模型,可用于糖尿病视网膜病变的筛查.Guo等[17 ] 基于改进的DenseNet(SK-DenseNet)对间质性肺疾病进行分类诊断,最佳结果达到0.984. Yang等[18 ] 使用DenseNet结合迁移学习的方法对不同放大倍数的乳腺癌图像进行识别,其准确率达到了0.98以上.以上研究证明DenseNet在医学图像分类任务中表现出了良好的性能,拥有较强的特征提取能力,因此选用DenseNet网络对MCN和SCN进行分类,以解决临床上人工分类准确率不高的问题. ...
... 加入优化算法可以提高网络的收敛速度,本文选用SGD[17 ] 、Adam[21 ] 、Adadelta[22 ] 、Adagrad[23 ] 、ASGD[24 ] 五种优化算法与DenseNet161网络结合,来验证网络结构的分类性能,实验结果表明,加入SGD优化算法后,动量(momentum)设置为0.9,网络模型的分类准确率最高,其收敛速度也较快.最后对网络模型进行微调整,选择归一化指数函数(softmax)激活函数结合分类器输出分类结果. ...
基于DenseNet和迁移学习的乳腺癌图像识别
1
2022
... 由于DenseNet出色的性能,其密集连接块可以利用到更多深层次的特征,目前被广泛应用于医学图像分类任务中.Zhou等[15 ] 将3D DenseNet与SENet相结合,对两级肝细胞癌进行分级,准确率可达0.83,表现出了优异性能.Wang等[16 ] 提出一种基于改进的FC-DenseNet对微动脉瘤进行检测,结果表明,所提出的MAS-FC-DenseNet是一种快速、准确检测出微动脉瘤的可靠模型,可用于糖尿病视网膜病变的筛查.Guo等[17 ] 基于改进的DenseNet(SK-DenseNet)对间质性肺疾病进行分类诊断,最佳结果达到0.984. Yang等[18 ] 使用DenseNet结合迁移学习的方法对不同放大倍数的乳腺癌图像进行识别,其准确率达到了0.98以上.以上研究证明DenseNet在医学图像分类任务中表现出了良好的性能,拥有较强的特征提取能力,因此选用DenseNet网络对MCN和SCN进行分类,以解决临床上人工分类准确率不高的问题. ...
Transfer learning and its application research
1
2021
... 深度学习依赖于大量的标注数据,而在医学图像领域,这需要有经验的医生花费大量的时间和精力进行标注,数据量不足是常见的问题.迁移学习技术指将先前领域学习到的特征和参数应用到新领域的手段,可以解决当前数据量不足的问题并且提高学习效率,增强模型的稳定性和泛化能力[19 ] .因此在医学图像领域可以提高疾病鉴别诊断的性能.迁移学习一般通过ImageNet数据集进行分类预训练[20 ] ,将预训练得到的网络模型初始化参数迁移到目标数据集进行微调训练.迁移学习可以学习到许多基本特征如边缘等,可以简化模型的调参过程以及减少训练时间,并且可以减少对大量数据的需求,有助于提高对目标数据集的分类能力. ...
迁移学习在医学图像分类中的研究进展
1
2022
... 深度学习依赖于大量的标注数据,而在医学图像领域,这需要有经验的医生花费大量的时间和精力进行标注,数据量不足是常见的问题.迁移学习技术指将先前领域学习到的特征和参数应用到新领域的手段,可以解决当前数据量不足的问题并且提高学习效率,增强模型的稳定性和泛化能力[19 ] .因此在医学图像领域可以提高疾病鉴别诊断的性能.迁移学习一般通过ImageNet数据集进行分类预训练[20 ] ,将预训练得到的网络模型初始化参数迁移到目标数据集进行微调训练.迁移学习可以学习到许多基本特征如边缘等,可以简化模型的调参过程以及减少训练时间,并且可以减少对大量数据的需求,有助于提高对目标数据集的分类能力. ...
Adam: A method for stochastic optimization
1
2014
... 加入优化算法可以提高网络的收敛速度,本文选用SGD[17 ] 、Adam[21 ] 、Adadelta[22 ] 、Adagrad[23 ] 、ASGD[24 ] 五种优化算法与DenseNet161网络结合,来验证网络结构的分类性能,实验结果表明,加入SGD优化算法后,动量(momentum)设置为0.9,网络模型的分类准确率最高,其收敛速度也较快.最后对网络模型进行微调整,选择归一化指数函数(softmax)激活函数结合分类器输出分类结果. ...
Adadelta: an adaptive learning rate method
1
2012
... 加入优化算法可以提高网络的收敛速度,本文选用SGD[17 ] 、Adam[21 ] 、Adadelta[22 ] 、Adagrad[23 ] 、ASGD[24 ] 五种优化算法与DenseNet161网络结合,来验证网络结构的分类性能,实验结果表明,加入SGD优化算法后,动量(momentum)设置为0.9,网络模型的分类准确率最高,其收敛速度也较快.最后对网络模型进行微调整,选择归一化指数函数(softmax)激活函数结合分类器输出分类结果. ...
Adaptive subgradient methods for online learning and stochastic optimization
1
2011
... 加入优化算法可以提高网络的收敛速度,本文选用SGD[17 ] 、Adam[21 ] 、Adadelta[22 ] 、Adagrad[23 ] 、ASGD[24 ] 五种优化算法与DenseNet161网络结合,来验证网络结构的分类性能,实验结果表明,加入SGD优化算法后,动量(momentum)设置为0.9,网络模型的分类准确率最高,其收敛速度也较快.最后对网络模型进行微调整,选择归一化指数函数(softmax)激活函数结合分类器输出分类结果. ...
Large scale distributed deep networks
1
2012
... 加入优化算法可以提高网络的收敛速度,本文选用SGD[17 ] 、Adam[21 ] 、Adadelta[22 ] 、Adagrad[23 ] 、ASGD[24 ] 五种优化算法与DenseNet161网络结合,来验证网络结构的分类性能,实验结果表明,加入SGD优化算法后,动量(momentum)设置为0.9,网络模型的分类准确率最高,其收敛速度也较快.最后对网络模型进行微调整,选择归一化指数函数(softmax)激活函数结合分类器输出分类结果. ...


