


引言
磁共振氘成像是近年涌现出的一种极具潜力的分子代谢成像新手段[1⇓-3].氘(2H或D)是氢(1H)的稳定同位素,具有与其相同的化学性质,也能通过磁共振手段检测[4⇓-6].传统的磁共振氢成像探测灵敏度高[7],但其需要借助复杂的信号抑制技术,才能从极强的水和脂信号背景中分离出浓度极低的分子代谢物信号,难以在体内实现代谢物的精准定量[8].相比而言,氘的自然丰度极低(~0.0115%),其固有背景信号极弱,无需复杂的水信号抑制,即可实现氘标记化合物的精准定量[9];此外,借助化学位移特性还可通过核磁共振氘谱(2H NMR)技术解析氘标记探针的各种下游代谢产物浓度,从而反映不同病理生理状态下的组织代谢特征[10⇓-12].因此,磁共振氘成像是一种能在活体水平下实现特定代谢通路可视化的方法,在肿瘤等重大疾病检测方面具有极好的临床应用前景[9,13,14].
目前磁共振氘成像应用研究中,氘标记葡萄糖是最常用的探针[6,11,15].葡萄糖是机体能量代谢的基本物质,在正常细胞中,葡萄糖被细胞摄取后会被转化成丙酮酸转运至线粒体中参与三羧酸循环(Tricarboxylic Acid Cycle,TCA)[16];而在肿瘤细胞中,即使在氧气充足的情况下,肿瘤细胞较正常细胞有更高的葡萄糖摄取率,且更倾向于通过糖酵解途径给细胞供能,导致生成大量的乳酸(Warburg效应)[17].通过2H NMR可探测氘标记的葡萄糖代谢产物,例如氘标记乳酸(2H-乳酸)可反映葡萄糖糖酵解通量,而氘标记谷氨酸盐/谷氨酰胺则间接反映了葡萄糖参与TCA循环的代谢通量[18].2017年,Lu等[10]利用2H NMR技术反映了大鼠不同麻醉状态下葡萄糖消耗速率和TCA循环通量;随后,De Feyter等[11]在脑胶质瘤患者中利用2H NMR成像实现了肿瘤组织和正常脑组织之间葡萄糖代谢特征差异的可视化;此外,Straathof等[12]通过氘标记葡萄糖在缺血性脑梗死动物模型中发现乳酸浓度高区域与脑缺血区域高度相关.由此可以看出,氘标记葡萄糖在研究机体葡萄糖能量代谢特征方面已得到广泛关注[14,15,19],近期也有一些工作试图通过临床3.0 T磁共振系统实现并推广该技术[20].
目前市面上使用最多的氘标记葡萄糖探针是[6,6’-2H2]-葡萄糖[6,11,21,22]和[1,2,3,4,5,6,6’-2H7]-葡萄糖[15,23⇓-25],但这两种氘标记葡萄糖造价极为高昂,按照人体剂量0.75 g/kg估算,磁共振氘成像在探针上需要花费上万元,这将严重阻碍该技术的临床推广.近期,作者所在课题组联合开发了一种新的氘标记葡萄糖[2,3,4,6,6’-2H5]-葡萄糖,由于在合成过程中使用低廉的糖苷和重水作为合成底物,且合成反应条件温和,其成本显著低于另外两种,动物实验也证明了这种新化合物可以通过大鼠胶质瘤模型测量糖酵解通量[26]. 本文的目标是对比三种氘标记葡萄糖[6,6’-2H2]-葡萄糖、[2,3,4,6,6’-2H5]-葡萄糖及[1,2,3,4,5,6,6’-2H7]-葡萄糖在大鼠脑胶质瘤C6细胞中的代谢差异,从而为[2,3,4,6,6’-2H5]-葡萄糖这一低成本的氘标记葡萄糖探针实现临床转化提供重要基础.
1 实验部分
1.1 仪器与试剂
1.1.1 细胞
大鼠脑胶质瘤C6细胞购自中国科学院典型培养物保藏委员会细胞库.
1.1.2 药品与试剂
[6,6’-2H2]-葡萄糖、[1,2,3,4,5,6,6’-2H7]-葡萄糖购自Sigma-Aldrich公司;[2,3,4,6,6’-2H5]-葡萄糖由深圳鼎邦生物科技有限公司合成;氘标记吡嗪(2H4-Pyrazine)购自加拿大Toronto Research Chemicals(TRC)公司;完全培养基(DMEM)、无酚红培养基、胎牛血清、磷酸盐缓冲液、胰蛋白酶、青霉素-链霉素均购自美国Gibco公司.
1.1.3 仪器
600 MHz超导NMR波谱仪(Bruker,AVANCE III 600 MHz,德国);5 mm NMR样品管(WILMAD,美国).
1.2 细胞培养与氘标记葡萄糖孵育
C6细胞用含有10%胎牛血清的DMEM培养基在37 ℃,5% CO2培养箱中培养,每3天补充一次生长培养基,待细胞长到瓶底面积的80%~85%后消化传代.
取对数生长期C6细胞,按每孔约1×10⁶的密度接种于6孔板中,培养至细胞融合度达到70%~80%时进行氘标记葡萄糖孵育.实验开始时先用温热的磷酸盐缓冲液洗涤细胞两次,然后加入不含胎牛血清的无酚红培养基,再分别给予5 mmol/L浓度的三种氘标记葡萄糖(共计5 μmol总量)进行孵育.分别在0、1、2、4、6 h时收集细胞培养基样品用于2H NMR检测.每组实验均重复3次(n=3).在6 h实验结束后,消化细胞,采用血球计数板方法计算各孔细胞数目.
1.3 样品制备、波谱采集与数据处理
2H NMR实验前,在每个细胞培养基样品中加入25 μL的2H4-吡嗪溶液,使得培养基中2H4-吡嗪浓度为1 mmol/L,作为后续代谢物浓度定量的内参使用.最终将总计500 μL(含475 μL细胞培养基)的样品转移至5 mm的NMR样品管中.
2H NMR谱采集在室温下通过600 MHz NMR波谱仪进行.序列采用 pulse-acquire序列,参数如下:采样时间为1 s,延迟时间为2 s,谱宽11 ppm(~1 015.4 Hz),采样点数为2 172,平均累加次数为1 024.
2H NMR谱在MestReNova v14(Mestrelab Research S.L.,西班牙)软件中进行下述处理:首先将2H NMR谱数据零填充到4 096点,随后进行指数窗函数处理(线宽拓展至1 Hz).每条谱线都经过手动相位校正和自动样条基线校正,通过线拟合工具分别提取2H4-吡嗪(8.6 ppm)、2H标记水(2H-水,4.7 ppm)、2H-葡萄糖(3.1~3.8 ppm)和2H-乳酸(1.3 ppm)的峰面积.由于每个样品中2H4-吡嗪的浓度已知(1 mmol/L),因此可以2H4-吡嗪为内参定量出2H-葡萄糖、2H-乳酸和2H-水在不同时刻的浓度.由于乳酸存在着两种同位素异构体[3-2H]-乳酸和[3,3’-2H2]-乳酸[23],而它们的比例未知,因此在本实验中只能给出转化至乳酸中2H的量,而无法定量出不同构型的2H-乳酸的具体产量.氘标记葡萄糖消耗量定义为加入的总葡萄糖含量与某时刻培养基中葡萄糖残留量的差值;2H-水产量定义为某时刻培养基中2H-水含量与自然丰度2H-水含量的差值,0 h培养基中测得的2H-水含量即为自然丰度下2H-水含量,为18.0±0.5 mmol/L [27].
1.4 统计学处理
用SPSS v25.0(IBM,美国)软件进行统计学分析,计量数据采用均值±标准差的形式表示,多组间显著性分析采用单因素方差(ANOVA/LSD)分析;相关性分析采用 Pearson分析和线性回归方程拟合.以p<0.05为差异有统计学意义.作图采用GraphPad Prism v8.0(GraphPad Software,美国)进行.
2 结果与讨论
2.1 细胞培养基的2 H NMR谱
采用2H NMR谱可检测细胞培养基中的三种氘标记葡萄糖及下游代谢产物(如2H-乳酸和2H-水)随时间变化的特征,如图1所示.以2H4-吡嗪为参照,随孵育时间增加,三种氘标记葡萄糖的信号均逐步降低,表示氘标记葡萄糖被逐渐消耗;而2H-乳酸和2H-水的信号强度随氘标记葡萄糖孵育时间呈相对增加的趋势.2H-乳酸的产生反映了C6细胞在运用葡萄糖时偏好于糖酵解获取能量的代谢特性.
图1
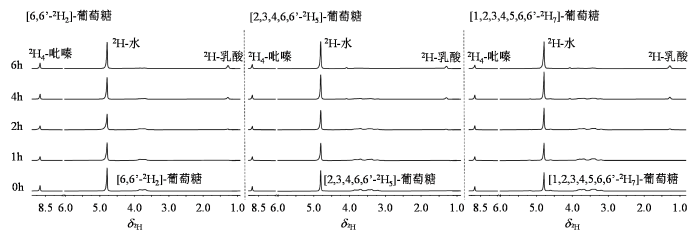
图1
经三种氘标记葡萄糖孵育不同时间后的C6细胞培养基的2H NMR谱
Fig. 1
2H NMR spectra of C6 cell culture medium cultured with three deuterium-labeled glucoses collected at different incubation times
2.2 细胞培养基中三种氘标记葡萄糖及代谢产物的定量分析
根据细胞培养基中残留的氘标记葡萄糖计算C6细胞对葡萄糖的消耗量,如图2(a)所示,随着孵育时间的增加,三种氘标记葡萄糖的消耗量呈增加趋势,统计分析显示三种氘标记葡萄糖之间的消耗量并无显著性差异,提示不同数量氘原子标记的葡萄糖不会影响肿瘤细胞的糖消耗量.
图2
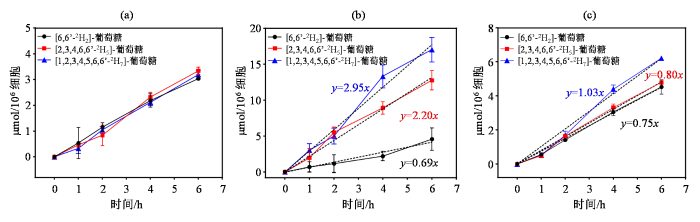
图2
经三种氘标记葡萄糖孵育的C6细胞培养基中,(a)氘标记葡萄糖消耗量、(b)氘标记水产量和(c)乳酸中的氘标记量随时间的变化
Fig. 2
(a) consumption of three deuterium-labelled glucoses, (b) production of deuterium-labelled water, and (c) deuterium contents in lactate over time in C6 cell culture medium cultured with three deuterium-labelled glucoses
图2(b)展示了三种氘标记葡萄糖的下游代谢产物2H-水产量随时间变化的曲线.生成的2H-水随着氘标记葡萄糖孵育时间和氘标记葡萄糖中的氘原子个数增加而增多,当孵育达4 h时,2H-水的产量在三种葡萄糖间呈现出显著性差异(p<0.05),其中[6,6’-2H2]-葡萄糖的2H-水产量为2.22±0.66 µmol/106细胞,[2,3,4,6,6’-2H5]-葡萄糖和[1,2,3,4,5,6,6’-2H7]-葡萄糖的2H-水产量分别为8.90±0.88 µmol/106细胞和13.32±1.61 µmol/106细胞.这主要是由于葡萄糖中的氘原子都会进入最终的代谢产物水中,因此氘标记的原子数越多,2H-水的产量也会越高.
图2(c)展示了三种氘标记葡萄糖中进入乳酸的氘原子量.氘标记葡萄糖糖酵解过程中会形成[3-2H]-乳酸和[3,3’-2H2]-乳酸两种同位素异构体,而在本实验中采用的核磁共振氘谱无法区分这两种同位素异构体的比例,因此,本文仅以2H4-吡嗪作为参考计算乳酸中氘原子的总数量.结果显示,乳酸的氘标记量随孵育时间逐渐增加,在孵育2 h后,[1,2,3,4,5,6,6’-2H7]-葡萄糖中乳酸的氘标记量开始逐渐高于其他两种,而[6,6’-2H2]-葡萄糖和[2,3,4,6,6’-2H5]-葡萄糖中乳酸的氘标记量无显著性差异.在孵育6 h后,[1,2,3,4,5,6,6’-2H7]-葡萄糖中乳酸的氘标记量为6.22±0.12 µmol/106细胞,是[6,6’-2H2]-葡萄糖的1.37倍([6,6’-2H2]-葡萄糖:4.53±0.42 µmol/106细胞),是[2,3,4,6,6’-2H5]-葡萄糖的1.30倍([2,3,4,6,6’-2H5]-葡萄糖:4.79±0.11 µmol/106细胞).这是因为[6,6’-2H2]-葡萄糖和[2,3,4,6,6’-2H5]-葡萄糖均只有C6上的两个氘原子在代谢反应中进入了乳酸分子,而[1,2,3,4,5,6,6’-2H7]-葡萄糖C1号位标记的氘原子也能进入乳酸分子[15],因此理论上[1,2,3,4,5,6,6’-2H7]-葡萄糖代谢的乳酸中氘标记量产量是其他两种氘标记葡萄糖的1.5倍.进一步地,如果借助1H NMR波谱解耦合技术[23]确定[3-2H]-乳酸和[3,3’-2H2]-乳酸两种同位素异构体的比例,可以对不同构型的2H-乳酸的产量进行精准定量.
2.3 氘标记葡萄糖消耗量与代谢物产量的相关性
葡萄糖消耗与代谢物水以及乳酸的氘标记量线性相关性如图3所示.其中图3(a)显示每0.74单位的[6,6’-2H2]-葡萄糖产生1单位的氘标记水,而0.25单位的[2,3,4,6,6’-2H5]-葡萄糖和0.18单位的[1,2,3,4,5,6,6’-2H7]-葡萄糖被用于生成1单位的氘标记水,R2 ≥ 0.97;图3(b)显示每0.70单位的[6,6’-2H2]-葡萄糖,和每0.69单位的[2,3,4,6,6’-2H5]-葡萄糖中有1单位的氘进入到乳酸分子中,而[1,2,3,4,5,6,6’-2H7]-葡萄糖则为0.51单位,R2 ≥ 0.99.结果表明,氘标记水产量和乳酸中的氘标记量与氘标记葡萄糖的氘原子个数密切相关.
图3

图3
(a)氘标记水产量和(b)乳酸中的氘标记量与氘标记葡萄糖消耗量之间的关系
Fig. 3
(a) The relationship of the deuterium-labelled water production and deuterium-labelled glucose consumption; (b) The relationship of the deuterium labels in lactate and deuterium-labelled glucose consumption
3 结论
本文对比了三种氘标记葡萄糖[6,6’-2H2]-葡萄糖、[2,3,4,6,6’-2H5]-葡萄糖及[1,2,3,4,5,6,6’-2H7]-葡萄糖在大鼠脑胶质瘤C6细胞中的代谢特征,结果证实了三种氘标记葡萄糖代谢的消耗量无显著性差异,氘标记水的产量随氘原子标记数量增加而升高,[2,3,4,6,6’-2H5]-葡萄糖与[6,6’-2H2]-葡萄糖中转化到乳酸的氘原子数量基本一致,而孵育6 h后[1,2,3,4,5,6,6’-2H7]-葡萄糖中转化到乳酸的氘原子数量约是另外两种氘标记葡萄糖的1.4倍,基本符合理论预期.总体结果表明了三种氘标记葡萄糖在反映肿瘤细胞代谢上具有相似的特性,因而低生产成本的[2,3,4,6,6’-2H5]-葡萄糖具有更高的临床转化价值.
利益冲突
无
致谢
作者感谢深圳鼎邦生物医学科技有限公司提供的氘标记葡萄糖探针.
参考文献
Old discovery leading to new era: metabolic imaging of cancer with deuterium MRI
[J].
DOI:10.3390/magnetochemistry9010006
URL
[本文引用: 1]

The understanding of metabolic compartments involved in the survival, growth and invasion of tumours is important for modern cancer research. Deuterium metabolic spectroscopy (DMS) and metabolic imaging (DMI) have been demonstrated as robust, straightforward tools for visualising tumour metabolism in vivo. However, for them to become part of the cancer patient’s management pathway in a clinical setting, there remain many obstacles to overcome. Technological advancement in magnetic resonance imaging hardware and processing is needed. Further justification of DMI’s potential also requires more human study and multidisciplinary collaboration.
Review of a new molecular imaging method—deuterium metabolic spectroscopy and imaging
[J].
分子影像新技术—氘代谢波谱及成像的综述与展望
[J].
A review of advances in magnetic resonance deuterium metabolic imaging research
[J].
磁共振氘代谢成像研究进展综述
[J].
A hydrogen isotope of mass 2 and its concentration
[J].
2H NMR study of deuterium distribution in molecule
[J].
2H NMR研究分子中氢同位素氘分布
[J].
Deuterium metabolic imaging in the human brain at 9.4 Tesla with high spatial and temporal resolution
[J].DOI:10.1016/j.neuroimage.2021.118639 URL [本文引用: 3]
Application of magnetic resonance spectroscopy in metabolic research
[J].DOI:10.1016/j.bbadis.2018.09.013 URL [本文引用: 1]
Quantitative analysis in magnetic resonance spectroscopy: from metabolic profiling to in vivo biomarkers
[J].
DOI:10.4155/bio.11.320
URL
[本文引用: 1]
Nuclear magnetic resonance spectroscopy (called NMR for ex vivo techniques and MRS for in vivo techniques) has become a useful analytical and diagnostic tool in biomedicine. In the past two decades, an MR-based spectroscopic approach for translational and clinical research has emerged that allows for biochemical characterization of the tissue of interest either ex vivo (NMR-based metabolomics) or in vivo (localized MRS-single voxel or multivoxel-spectroscopic imaging). The greatest advantages of MRS techniques are their ability to detect multiple tissue-specific metabolites in a single experiment, their quantitative nature and translational component (in vitro/ex vivo-discovered metabolic biomarkers can be translated into noninvasive spectroscopic imaging protocols). Disadvantages of MRS include low sensitivity and spectral resolution and, in case of NMR-metabolomics, metabolite degradation and incomplete recovery in processed samples. In vivo MRS has worse spectral resolution than ex vivo high-resolution NMR due to the inherently wider lines of metabolites in vivo and the difficulty of using traditional line-narrowing methods (e.g., sample spinning). It also suffers from poor time-resolution, therefore offering fewer metabolic biomarkers to be followed in vivo. In the present review article, we provide considerations for establishing reliable protocols (both in vivo and ex vivo) for metabolite detection, recovery and quantification from in vivo and ex vivo MR spectra.
Deuterium metabolic imaging - Back to the future
[J].DOI:10.1016/j.jmr.2021.106932 URL [本文引用: 2]
Quantitative assessment of brain glucose metabolic rates using in vivo deuterium magnetic resonance spectroscopy
[J].
DOI:10.1177/0271678X17706444
URL
[本文引用: 2]
Quantitative assessment of cerebral glucose consumption rate (CMRglc) and tricarboxylic acid cycle flux (VTCA) is crucial for understanding neuroenergetics under physiopathological conditions. In this study, we report a novel in vivo Deuterium (2H) MRS (DMRS) approach for simultaneously measuring and quantifying CMRglc and VTCA in rat brains at 16.4 Tesla. Following a brief infusion of deuterated glucose, dynamic changes of isotope-labeled glucose, glutamate/glutamine (Glx) and water contents in the brain can be robustly monitored from their well-resolved 2H resonances. Dynamic DMRS glucose and Glx data were employed to determine CMRglc and VTCA concurrently. To test the sensitivity of this method in response to altered glucose metabolism, two brain conditions with different anesthetics were investigated. Increased CMRglc (0.46 vs. 0.28 µmol/g/min) and VTCA (0.96 vs. 0.6 µmol/g/min) were found in rats under morphine as compared to deeper anesthesia using 2% isoflurane. This study demonstrates the feasibility and new utility of the in vivo DMRS approach to assess cerebral glucose metabolic rates at high/ultrahigh field. It provides an alternative MRS tool for in vivo study of metabolic coupling relationship between aerobic and anaerobic glucose metabolisms in brain under physiopathological states.
Deuterium metabolic imaging (DMI) for MRI-based 3D mapping of metabolism in vivo
[J].
DOI:10.1126/sciadv.aat7314
URL
[本文引用: 4]
DMI shows metabolism of acetate and glucose in the brain and liver and reveals the Warburg effect in patients with brain tumors.
Deuterium metabolic imaging of the healthy and diseased brain
[J].
DOI:10.1016/j.neuroscience.2021.01.023
PMID:33493618
[本文引用: 2]
Altered brain metabolism contributes to pathophysiology in cerebrovascular and neurodegenerative diseases such as stroke and Alzheimer's disease. Current clinical tools to study brain metabolism rely on positron emission tomography (PET) requiring specific hardware and radiotracers, or magnetic resonance spectroscopy (MRS) involving technical complexity. In this review we highlight deuterium metabolic imaging (DMI) as a novel translational technique for assessment of brain metabolism, with examples from brain tumor and stroke studies. DMI is an MRS-based method that enables detection of deuterated substrates, such as glucose, and their metabolic products, such as lactate, glutamate and glutamine. It provides additional detail of downstream metabolites compared to analogous approaches like fluorodeoxyglucose (FDG)-PET, and can be implemented and executed on clinical and preclinical MR systems. We foresee that DMI, with future improvements in spatial and temporal resolutions, holds promise to become a valuable MR imaging (MRI) method for non-invasive mapping of glucose uptake and its downstream metabolites in healthy and diseased brain.Copyright © 2021 The Author(s). Published by Elsevier Ltd.. All rights reserved.
Monitoring tumor cell death in murine tumor models using deuterium magnetic resonance spectroscopy and spectroscopic imaging
[J].
Measuring tumor glycolytic flux in vivo by using fast deuterium MRI
[J].DOI:10.1148/radiol.2019191242 URL [本文引用: 2]
Deuterated water imaging of the rat brain following metabolism of [2H7]glucose
[J].DOI:10.1002/mrm.v85.6 URL [本文引用: 4]
Mitochondrial TCA cycle metabolites control physiology and disease
[J].
DOI:10.1038/s41467-019-13668-3
[本文引用: 1]
Mitochondria are signaling organelles that regulate a wide variety of cellular functions and can dictate cell fate. Multiple mechanisms contribute to communicate mitochondrial fitness to the rest of the cell. Recent evidence confers a new role for TCA cycle intermediates, generally thought to be important for biosynthetic purposes, as signaling molecules with functions controlling chromatin modifications, DNA methylation, the hypoxic response, and immunity. This review summarizes the mechanisms by which the abundance of different TCA cycle metabolites controls cellular function and fate in different contexts. We will focus on how these metabolites mediated signaling can affect physiology and disease.
Understanding the Warburg effect: the metabolic requirements of cell proliferation
[J].
DOI:10.1126/science.1160809
PMID:19460998
[本文引用: 1]
In contrast to normal differentiated cells, which rely primarily on mitochondrial oxidative phosphorylation to generate the energy needed for cellular processes, most cancer cells instead rely on aerobic glycolysis, a phenomenon termed "the Warburg effect." Aerobic glycolysis is an inefficient way to generate adenosine 5'-triphosphate (ATP), however, and the advantage it confers to cancer cells has been unclear. Here we propose that the metabolism of cancer cells, and indeed all proliferating cells, is adapted to facilitate the uptake and incorporation of nutrients into the biomass (e.g., nucleotides, amino acids, and lipids) needed to produce a new cell. Supporting this idea are recent studies showing that (i) several signaling pathways implicated in cell proliferation also regulate metabolic pathways that incorporate nutrients into biomass; and that (ii) certain cancer-associated mutations enable cancer cells to acquire and metabolize nutrients in a manner conducive to proliferation rather than efficient ATP production. A better understanding of the mechanistic links between cellular metabolism and growth control may ultimately lead to better treatments for human cancer.
Glucose fluxes in glycolytic and oxidative pathways detected in vivo by deuterium magnetic resonance spectroscopy reflect proliferation in mouse glioblastoma
[J].DOI:10.1016/j.nicl.2021.102932 URL [本文引用: 1]
NMR visibility of deuterium-labeled liver glycogen in vivo
[J].DOI:10.1002/mrm.v86.1 URL [本文引用: 1]
Deuterium metabolic imaging and hyperpolarized13C-MRI of the normal human brain at clinical field strength reveals differential cerebral metabolism
[J].DOI:10.1016/j.neuroimage.2022.119284 URL [本文引用: 1]
Improving deuterium metabolic imaging (DMI) signal-to-noise ratio by spectroscopic multi-echo bSSFP: A pancreatic cancer investigation
[J].
DOI:10.1002/mrm.28906
PMID:34196041
[本文引用: 1]
Deuterium metabolic imaging (DMI) maps the uptake of deuterated precursors and their conversion into lactate and other markers of tumor metabolism. Even after leveraging H's short T s, DMI's signal-to-noise ratio (SNR) is limited. We hypothesize that a multi-echo balanced steady-state free precession (ME-bSSFP) approach would increase SNR compared to chemical shift imaging (CSI), while achieving spectral isolation of the metabolic precursors and products.Suitably tuned H ME-bSSFP (five echo times [TEs], ΔTE = 2.2 ms, repetition time [TR]/flip-angle = 12 ms/60°) was implemented at 15.2T and compared to CSI (TR/flip-angle = 95 ms/90°) regarding SNR and spectral isolation, in simulations, in deuterated phantoms and for the in vivo diagnosis of a mouse tumor model of pancreatic adenocarcinoma (N = 10).Simulations predicted an SNR increase vs. CSI of 3-5, and that the peaks of H-water, H -glucose, and H -lactate can be well isolated by ME-bSSFP; phantoms confirmed this. In vivo, at equal spatial resolution (1.25 × 1.25 mm ) and scan time (10 min), H -glucose's and H -lactate's SNR were indeed higher for bSSFP than for CSI, three-fold for glucose (57 ± 30 vs. 19 ± 11, P <.001), doubled for water (13 ± 5 vs. 7 ± 3, P =.005). The time courses and overall localization of all metabolites agreed well, comparing CSI against ME-bSSFP. However, a clearer localization of glucose in kidneys and bladder, the detection of glucose-avid rims in certain tumors, and a heterogeneous pattern of intra-tumor lactate production could only be observed using ME-bSSFP's higher resolution.ME-bSSFP provides greater SNR per unit time than CSI, providing for higher spatial resolution mapping of glucose uptake and lactate production in tumors.© 2021 International Society for Magnetic Resonance in Medicine.
Simultaneous recording of the uptake and conversion of glucose and choline in tumors by deuterium metabolic imaging
[J].
DOI:10.3390/cancers13164034
URL
[本文引用: 1]
Increased glucose and choline uptake are hallmarks of cancer. We investigated whether the uptake and conversion of [2H9]choline alone and together with that of [6,6′-2H2]glucose can be assessed in tumors via deuterium metabolic imaging (DMI) after administering these compounds. Therefore, tumors with human renal carcinoma cells were grown subcutaneously in mice. Isoflurane anesthetized mice were IV infused in the MR magnet for ~20 s with ~0.2 mL solutions containing either [2H9]choline (0.05 g/kg) alone or together with [6,6′-2H2]glucose (1.3 g/kg). 2H MR was performed on a 11.7T MR system with a home-built 2H/1H coil using a 90° excitation pulse and 400 ms repetition time. 3D DMI was recorded at high resolution (2 × 2 × 2 mm) in 37 min or at low resolution (3.7 × 3.7 × 3.7 mm) in 2:24 min. Absolute tissue concentrations were calculated assuming natural deuterated water [HOD] = 13.7 mM. Within 5 min after [2H9]choline infusion, its signal appeared in tumor spectra representing a concentration increase to 0.3–1.2 mM, which then slowly decreased or remained constant over 100 min. In plasma, [2H9]choline disappeared within 15 min post-infusion, implying that its signal arises from tumor tissue and not from blood. After infusing a mixture of [2H9]choline and [6,6′-2H2]glucose, their signals were observed separately in tumor 2H spectra. Over time, the [2H9]choline signal broadened, possibly due to conversion to other choline compounds, [[6,6′-2H2]glucose] declined, [HOD] increased and a lactate signal appeared, reflecting glycolysis. Metabolic maps of 2H compounds, reconstructed from high resolution DMIs, showed their spatial tumor accumulation. As choline infusion and glucose DMI is feasible in patients, their simultaneous detection has clinical potential for tumor characterization.
HDO production from [2H7]glucose quantitatively identifies Warburg metabolism
[J].
DOI:10.1038/s41598-020-65839-8
[本文引用: 3]
Increased glucose uptake and aerobic glycolysis are striking features of many cancers. These features have led to many techniques for screening and diagnosis, but many are expensive, less feasible or have harmful side-effects. Here, we report a sensitive 1H/2H NMR method to measure the kinetics of lactate isotopomer and HDO production using a deuterated tracer. To test this hypothesis, HUH-7 hepatocellular carcinoma and AML12 normal hepatocytes were incubated with [2H7]glucose. 1H/2H NMR data were recorded for cell media as a function of incubation time. The efflux rate of lactate-CH3, lactate-CH2D and lactate-CHD2 was calculated as 0.0033, 0.0071, and 0.0.012 µmol/106cells/min respectively. Differential production of lactate isotopomers was due to deuterium loss during glycolysis. Glucose uptake and HDO production by HUH-7 cells showed a strong correlation, indicating that monitoring the HDO production could be a diagnostic feature in cancers. Deuterium mass balance of [2H7]glucose uptake to 2H-lactate and HDO production is quantitatively matched, suggesting increasing HDO signal could be used to diagnose Warburg (cancer) metabolism. Measuring the kinetics of lactate isotopomer and HDO production by 1H and 2H MR respectively are highly sensitive. Increased T1 of 2H-lactate isotopomers indicates inversion/saturation recovery methods may be a simple means of generating metabolism-based contrast.
Measuring NQO1 bioactivation using [2H7]glucose
[J].
DOI:10.3390/cancers13164165
URL
[本文引用: 1]
Treatment of cancers with β-lapachone causes NAD(P)H: quinone oxidoreductase 1 (NQO1) to generate an unstable hydroquinone that regenerates itself in a futile cycle while producing reactive oxygen species (ROS) in the form of superoxide and subsequently hydrogen peroxide. Rapid accumulation of ROS damages DNA, hyperactivates poly-ADP-ribose polymerase-I, causes massive depletion of NAD+/ATP, and hampers glycolysis. Cells overexpressing NQO1 subsequently die rapidly through an NAD+-keresis mechanism. Assessing changes in glycolytic rates caused by NQO1 bioactivation would provide a means of assessing treatment efficacy, potentially lowering the chemotherapeutic dosage, and reducing off-target toxicities. NQO1-mediated changes in glycolytic flux were readily detected in A549 (lung), MiaPaCa2 (pancreatic), and HCT-116 (colon) cancer cell lines by 2H-NMR after administration of [2H7]glucose. The deuterated metabolic products 2H-lactate and HDO were quantified, and linear relationships with glucose consumption for both products were observed. The higher concentration of HDO compared to 2H-lactate allows for more sensitive measurement of the glycolytic flux in cancer. Gas chromatography-mass spectrometry analysis agreed with the NMR results and confirmed downregulated energy metabolism in NQO1+ cells after β-lapachone treatment. The demonstrated method is ideal for measuring glycolytic rates, the effects of chemotherapeutics that target glycolysis, and has the potential for in vivo translation.
Measuring glycolytic activity with hyperpolarized [2H7, U-13C6] D-glucose in the naive mouse brain under different anesthetic conditions
[J].
DOI:10.3390/metabo11070413
URL
[本文引用: 1]
Glucose is the primary fuel for the brain; its metabolism is linked with cerebral function. Different magnetic resonance spectroscopy (MRS) techniques are available to assess glucose metabolism, providing complementary information. Our first aim was to investigate the difference between hyperpolarized 13C-glucose MRS and non-hyperpolarized 2H-glucose MRS to interrogate cerebral glycolysis. Isoflurane anesthesia is commonly employed in preclinical MRS, but it affects cerebral hemodynamics and functional connectivity. A combination of low doses of isoflurane and medetomidine is routinely used in rodent functional magnetic resonance imaging (fMRI) and shows similar functional connectivity, as in awake animals. As glucose metabolism is tightly linked to neuronal activity, our second aim was to assess the impact of these two anesthetic conditions on the cerebral metabolism of glucose. Brain metabolism of hyperpolarized 13C-glucose and non-hyperpolaized 2H-glucose was monitored in two groups of mice in a 9.4 T MRI system. We found that the very different duration and temporal resolution of the two techniques enable highlighting the different aspects in glucose metabolism. We demonstrate (by numerical simulations) that hyperpolarized 13C-glucose reports on de novo lactate synthesis and is sensitive to cerebral metabolic rate of glucose (CMRGlc). We show that variations in cerebral glucose metabolism, under different anesthesia, are reflected differently in hyperpolarized and non-hyperpolarized X-nuclei glucose MRS.
A new deuterium-labeled compound [2,3,4,6,6’-2H5]-D-glucose for deuterium magnetic resonance metabolic imaging
[J].
Pharmacokinetic analysis of absorption, distribution and disappearance of ingested water labeled with D₂O in humans
[J].
DOI:10.1007/s00421-011-2194-7
PMID:21997675
[本文引用: 1]
The kinetic parameters of absorption and distribution of ingested water (300 ml labeled with D(2)O; osmolality <20 mOsm kg(-1)) in the body water pool (BWP) and of its disappearance from this pool were estimated in 36 subjects from changes in plasma or urine deuterium to protium ratio (D/H) over 10 days using one- and two-compartment and a non-compartmental pharmacokinetic models (1-CM, 2-CM and N-CM which applied well to 58, 42 and 100% of the subjects, respectively). Compared with the volume and turnover of the BWP computed with the slope-intercept method (60.7 ± 4.1% body mass or 72.7 ± 3.2% lean body mass; turnover 4.58 ± 0.80 l day(-1): i.e., complete renewal in ~50 days; n = 36), the values were accurately estimated with the N-CM and 1-CM and were slightly overestimated and underestimated, respectively, with the 2-CM (~7-8% difference, significant for water clearance only). Ingested water appeared in plasma and blood cells within 5 min and the half-life of absorption (~11-13 min) indicates a complete absorption within ~75-120 min. The 2-CM showed that in 42% of the subjects, ingested water quickly distributed within a central compartment before diffusing with a very short half-life (12.5 ± 4.3 min) to a peripheral compartment (18.5 ± 4.3 and 31.6 ± 6.4 L, respectively), which were in complete equilibrium within ~90 min. Pharmacokinetic analyses of water labeled with D(2)O can help describe water absorption and distribution, for which there is no well defined reference method and value; depending on the characteristics of the subjects and the drinks, and of environmental conditions.
