


引言
大脑年龄,也被称为大脑的生物学年龄,是一种反映大脑衰老程度的概念[6]. 大脑衰老是指与患者实际年龄相比,个体大脑预测年龄更大的现象[7]. 大脑预测年龄差异(predicted age difference,PAD)是基于神经影像学预测的大脑年龄与实际年龄之间的差异,与认知衰老和年龄相关疾病的风险有关[8]. 大脑年龄这种基于神经影像学的生物标志物在多种神经系统疾病中均有应用[9],包括但不限于精神分裂症[10]、阿尔茨海默病[11]、癫痫[12]等. 大脑年龄能够从侧面揭示患者偏离健康的轨迹,一定程度上可以反映MDD患者大脑的病理过程,这让患者能够得到个体层面的诊断,并使个性化治疗成为可能.
机器学习算法在大脑预测年龄领域显示出巨大的前景,ENIGMA团队通过澳大利亚2 533名健康人群的大脑功能磁共振数据训练机器模型,预测了3 211名MDD患者的大脑年龄[5],发现MDD患者表现出更高的平均大脑PAD,但这种结果并不是临床特征决定的. Han等人通过400名国外健康人群的大脑sMRI训练高斯过程回归模型[16],研究了195名首次发作抑郁症患者大脑衰老的情况,发现当疾病发作时,大脑会加速衰老,并且这种现象可能与患者的临床特征有关. CAN-BIND团队通过加拿大的公开数据集中3 377名健康人群的大脑sMRI训练机器学习模型,对国外MDD患者进行研究[17],发现老年MDD患者的平均大脑PAD明显更高. 但是,迄今为止,MDD是否会加速大脑衰老还没有得到一致的结论,其中2019年Besteher等人[18]和Kaufmann等人[19]通过小样本对MDD患者进行脑龄预测研究,以及2020年Christman等人[20]和Schmaal等人[13]的研究表明MDD和大脑衰老并无关联.
上述研究从多个方面揭示了MDD与大脑衰老之间的联系,但仍然存在一定的局限性. 第一,结论的稳定性取决于样本的大小. 第二,多数研究基于国外受试者进行,但研究结论需要在不同种族和文化背景的受试者中进行比较. 第三,过往通过大脑sMRI对MDD的研究较少,缺乏对中国患者的大脑年龄预测. 考虑到研究MDD与大脑衰老联系的必要性,本文第一部分选择合适的模型和评价指标,第二部分选择中国人口数据集,基于卷积神经网络(convolutional neural network,CNN)利用大脑sMRI构建大脑年龄预测模型,得到MDD患者和健康人的大脑年龄差异,第三部分讨论大脑年龄差异与临床特征之间的关系. 最后得出结论,并提出未来进一步发展的方向.
1 研究方法
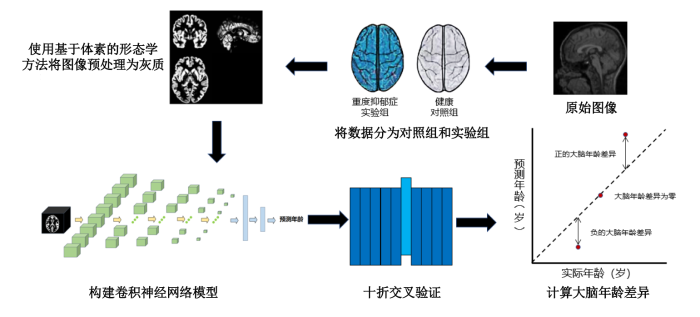
本文通过研究sMRI间接量化个体大脑衰老状态来预测大脑年龄[21],其过程如图1所示. 首先,通过大量健康样本的大脑神经影像学数据,识别与年龄有关的典型结构和参数,生成预测模型. 随后,将大脑年龄预测模型应用于未知的测试对象,利用sMRI数据估计受试者的大脑年龄,计算预测年龄和实际年龄的差值,如果预测的大脑年龄比实际年龄大,则表示大脑加速衰老,如果比实际年龄小,则代表大脑更加年轻. 过往的研究使用支持向量回归(support vector regression, SVR)[22]、相关性向量回归[23]或高斯过程回归[24]等机器学习方法预测大脑年龄. 随着深度学习算法的持续改进,大脑年龄预测的准确性和可靠性都有了更进一步的提升[25].
图1
1.1 模型构建与优化
CNN的发展极大地促进了医学生物识别技术在健康诊断中的应用,特别是在了解大脑的结构和功能方面. 本研究使用深度学习方法完成MDD患者的大脑年龄预测任务. CNN是一种复杂的架构,它由卷积层、池化层、激活函数层以及全连接层组成,如图2所示. 其中卷积层负责处理输入数据,实现有效的模型预测. 卷积层的运算公式如(1)式所示:
式中:
图2
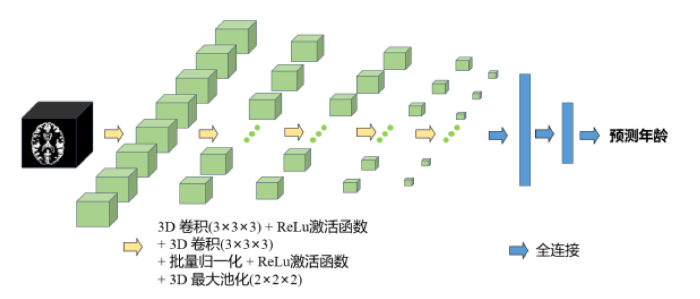
本研究使用的3D CNN框架基于VGG-13模型,将VGG-13中的2D卷积层和2D池化层替换为3D卷积层和3D池化层,并在池化层前添加了批量归一化层. CNN的架构模型包括5个由3×3×3的重叠栈卷积层、ReLu激活函数、3×3×3的卷积层、批量归一化、ReLu激活函数和2×2×2的最大池化层组成的子模块,以及3个全连接层. 模型输入维度为121×145×121的灰质图像,输出受试者的预测大脑年龄. 通过使用KL散度损失函数训练模型,进行反向优化获得更准确的预测结果,使用Adam优化器,优化算法的参数.
KL损失函数的公式如(2)式所示:
(2)式中:
1.2 模型评价指标
在训练过程中,模型的性能基于以下三个指标进行评估:平均绝对误差(Mean Absolute Error,MAE)、皮尔森相关系数r和确定系数R2.
MAE的计算公式为:
r的公式为:
R2的公式为:
式中:n是样本数量,
2 实验与验证
2.1 数据集
本实验数据来自中国REST-meta-MDD联盟,这是一个从中国25家医院收集的大规模MRI数据集[26],每家医院的具体大脑磁共振扫描参数如表1所示. 数据包含1 276名MDD患者和1 101名正常对照的样本集,该项目均已得到当地伦理委员会的批准,参与者在所属站点均已签署知情同意书. MDD组样本平均年龄为36.2岁,标准差为14.6岁,女性813人,占比63.7%,男性463人,占比36.3%. 健康组样本平均年龄为36.2岁,标准差为15.7岁,女性640人,占比58.2%,男性461人,占比41.8%. 统计表明数据集分布不平衡,老年组的数据样本较少,青年组的数据样本较多. 具体年龄分布如图3所示,年龄组分布如表2所示,受教育程度组分布如表3所示.
表1 不同医院的磁共振采集参数
Table 1
| 医院序号 | 扫描仪 | 圈 | 重复时间/ms | 回波时间/ms | 反转角/° | 厚度/mm | 层数 | 时间点/s |
|---|---|---|---|---|---|---|---|---|
| 1 | Siemens Tim Trio 3 T | 32 | 2000 | 30 | 90 | 4.0/0.8 | 30 | 210 |
| 2 | Philips Achieva 3 T | 8 | 2000 | 30 | 90 | 4.0/0 | 37 | 200 |
| 3 | Siemens 1.5 T | 16 | 2000 | 40 | 90 | 5.0/1.2 | 26 | 150 |
| 3 | GE Signa 3 T | 32 | 2000 | 30 | 90 | 5.0/0 | 22 | 100 |
| 6 | Siemens Tim Trio 3 T | 32 | 2000 | 30 | 70 | 4/0 | 33 | 180 |
| 7 | GE discovery MR750 | 8 | 2000 | 30 | 90 | 3.2/0 | 37 | 184 |
| 8 | GE Signa 3 T | 8 | 2000 | 30 | 90 | 3.0/0 | 35 | 200 |
| 9 | GE Discovery MR750 3.0 T | 8 | 2000 | 25 | 90 | 3.0/1.0 | 35 | 200 |
| 10 | Siemens Tim Trio 3 T | 32 | 2000 | 30 | 90 | 3.0/1.52 | 32 | 212 |
| 11 | GE Signa 3 T | 8 | 2000 | 30 | 90 | 5 | 33 | 200 |
| 12 | GE Signa 3 T | 8 | 2000 | 30 | 90 | 5 | 33 | 240 |
| 13 | GE Excite 1.5 T | 16 | 2500 | 35 | 90 | 4 /0 | 36 | 150 |
| 14 | Siemens Tim Trio 3 T | 32 | 2500 | 25 | 90 | 3.5/0 | 39 | 200 |
| 15 | Siemens Verio 3.0 T MRI | 12 | 2000 | 25 | 90 | 4/0 | 36 | 240 |
| 16 | GE Signa 3 T | 8 | 2000 | 30 | 90 | 5/0 | 30 | 200 |
| 17 | GE Signa 3 T | 8 | 2000 | 40 | 90 | 4.0/0 | 33 | 240 |
| 18 | Philips Achieva 3.0 T scanner | 8 | 2000 | 35 | 90 | 5.0/1.0 | 24 | 200 |
| 19 | GE Signa 3 T | 8 | 2000 | 22.5 | 30 | 4.0/0.6 | 33 | 240 |
| 20 | Siemens Tim Trio 3 T | 12 | 2000 | 30 | 90 | 3.0/1.0 | 32 | 242 |
| 21 | Siemens Tim Trio 3 T | 32 | 2000 | 30 | 90 | 3.5/0.7 | 33 | 240 |
| 22 | Philips Gyroscan Achieva 3.0 T | 32 | 2000 | 30 | 90 | 4.0 /0 | 36 | 250 |
| 23 | Philips Achieva 3.0 T TX | 8 | 2000 | 30 | 90 | 4.0/0 | 38 | 240 |
| 24 | GE Signa 1.5 T | 8 | 2000 | 40 | 90 | 5/1 | 24 | 160 |
| 25 | Siemens Verio 3 T | 12 | 2000 | 25 | 90 | 4.0/0 | 36 | 240 |
图3
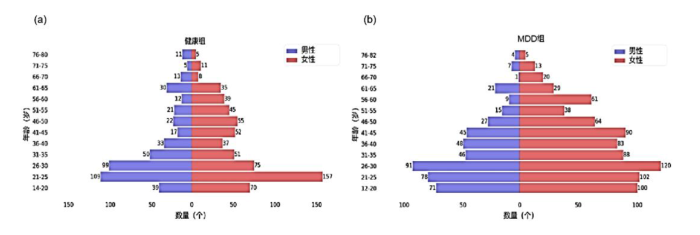
图3
健康组(a)和MDD组(b)人口年龄金字塔图
Fig. 3
Population age pyramids for (a) healthy group and (b) MDD group
表2 健康组和MDD组年龄分布
Table 2
| 对象 | 年龄/岁 | 健康组 | MDD组 | |||
|---|---|---|---|---|---|---|
| 总数 | 占比 | 总数 | 占比 | |||
| 青少年组 | 12~35 | 650 | 59.04% | 696 | 54.55% | |
| 中年组 | 36~59 | 332 | 30.15% | 468 | 36.68% | |
| 老年组 | 60~82 | 119 | 10.81% | 112 | 8.78% | |
表3 健康组和MDD组受教育程度分布
Table 3
| 受教育程度 | 受教育年限/年 | 健康组 | MDD组 | |||
|---|---|---|---|---|---|---|
| 总数 | 占比 | 总数 | 占比 | |||
| 小学及以下 | 0~6 | 142 | 12.89% | 151 | 11.83% | |
| 初中 | 7~9 | 136 | 12.35% | 272 | 21.32% | |
| 高中 | 10~12 | 197 | 17.90% | 327 | 25.63% | |
| 大专及以上 | 13及以上 | 626 | 56.86% | 526 | 41.22% | |
2.2 数据预处理
实验数据采用基于体素的形态学方法(voxel-based morphometry,VBM)进行预处理[27],获得灰质图像,这种图像可以用于基于体素和基于切片的预测模型,提高预测精度和准确性. 所有数据均参考Franke等人提出的BrainAGE协议[22],使用基于SPM12的CAT12工具箱(
图4

2.3 模型验证
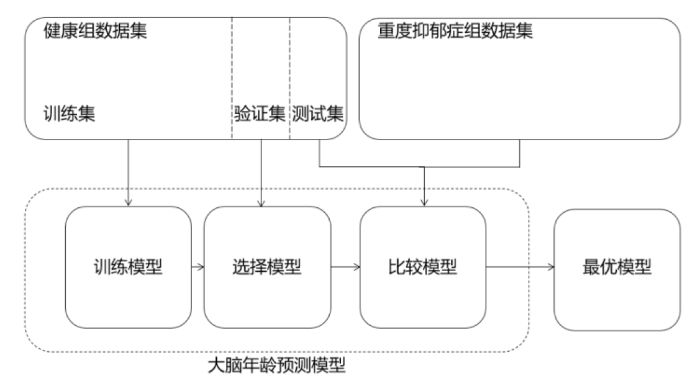
对所有方法,本实验均通过十折交叉验证评估预测模型的性能(图5),实验将健康组1 101份数据集分为881份训练集、110份验证集和110份测试集. 首先把数据集分成大小相等的十个互不相交的子集,然后依次将其中一份数据子集作为测试集,一份数据子集作为验证集,剩下的作为训练集用于训练模型,最后选取验证集中MAE最小的模型作为最终模型. 从而根据实际训练样本中识别的神经影像学参数预测单个大脑年龄,重复多次,直到在整个样本中预测出每个受试者的大脑年龄.
图5
2.4 实验环境
本实验采用的实验平台为PC(Intel(R)Core(TM)i9-10900KCPU@3.7GHz, RAM64GB)和NVIDIA GeForce RTX 3090GPU. 在Windows 10操作系统上运行,NVIDIA显卡驱动版本为CUDA 11.5,GPU加速库为CUDNN 8.3.2,以满足神经网络的需求. 在本次实验中,通过使用Python语言和PyTorch框架来构建网络模型. 利用Adam优化器来优化超参数,将每个卷积层的初始化方式定义为He,学习率设置为0.002,批处理大小设置为32,训练轮次(epoch)设置为500次.
2.5 统计分析
本研究旨在探索MDD患者与正常对照组之间存在的大脑年龄差异,实验在健康对照组的数据集中进行训练和测试,优化参数后,将训练好的模型应用于MDD组,预测被试的大脑年龄. 用预测年龄减去实际年龄得到大脑PAD,之后挖掘平均大脑PAD与临床特征之间的关系,包括性别、年龄和受教育程度. 此外,实验使用双样本t检验比较数据集中MDD和健康对照组的平均大脑PAD,因为p<0.05表明两个样本均值之间存在统计学上的显著差异,所以阈值设置为p<0.05.
其中大脑预测年龄差异PAD的计算公式为:
式中:
2.6 方法对比
为与传统机器学习方法比较,SVR、岭回归(ridge regression,RR)、套索回归(least absolute shrinkage and selection operator,Lasso)三种传统机器学习算法建立回归模型, 并参考过往在大脑年龄研究领域中对机器学习模型进行优化的方法[28],通过特征选择、超参数调整、正则化等方法对SVR、RR、Lasso三种传统机器学习算法进行优化. 其中SVR是一种能够处理非线性回归问题的算法,使用支持向量机进行回归分析. RR是一种改良的最小二乘估计法,主要应用于回归分析中的线性模型. 它的主要目标是找到一个回归系数集,使实际输出与预测输出之间的误差尽可能小. Lasso是一种线性回归算法,使用L1正则化增强模型对于噪声数据或冗余特征的抵抗力,从而提高模型的泛化能力.
3 结果与讨论
3.1 模型性能
表4 模型性能与传统机器学习算法的比较
Table 4
| 方法 | MAE | r | R2 |
|---|---|---|---|
| SVR | 5.65 | 0.92 | 0.85 |
| RR | 4.84 | 0.94 | 0.88 |
| Lasso | 4.97 | 0.93 | 0.86 |
| CNN | 2.85 | 0.98 | 0.96 |
图6
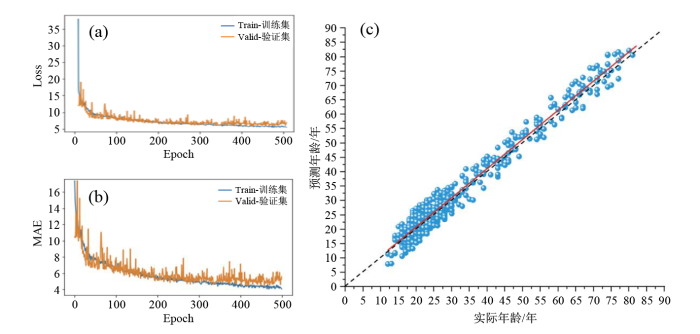
图6
模型的训练过程及模型在健康组中的表现.(a)Loss曲线;(b)MAE曲线;(c)预测年龄与实际年龄的散点图
Fig. 6
Model training process and model performance in healthy group.(a) Loss curve;(b) MAE curve;(c) Scatter plot of predicted age and chronological age
3.2 平均大脑PAD与临床特征的相关性
大脑PAD是通过大脑预测年龄减去实际年龄得到的差值,把不同实验组和对照组运用独立样本t检验[29],以下结论均为p < 0. 05的前提下得出. 将上节中本研究构建的CNN模型应用于MDD组所有数据(MAE = 3.16,r = 0.93,R2 = 0.86)和健康对照组所有数据(MAE = 1.35,r = 0.98,R2 = 0.96),结果显示MDD患者的平均大脑PAD为+4.32年,健康对照组的平均大脑PAD为+0.38年,MDD患者的平均大脑PAD比健康对照组高3.94年,证实了MDD会增加患者的大脑年龄.
为了探索性别、年龄和受教育程度因素带来的影响. 实验单独使用健康男性和健康女性数据作为训练集建立预测模型,分别预测不同性别MDD患者的大脑年龄,并使用双样本t检验比较不同性别组之间的平均大脑PAD. 结果显示女性MDD患者的平均大脑PAD更高(男性+3.88年,女性+4.65年),说明女性在MDD这类神经退行性疾病中受到的伤害更大.
此外,将MDD数据集分为12~35岁的青少年组、36~59岁的中年组,以及60岁以上的老年组,分别预测大脑年龄,结果显示青年组的平均大脑PAD为+4.82年(中年组+3.55年,老年组+2.90年),是所有年龄段中表现最高的,这从侧面反映了随着人类年龄的增长,大脑结构从整体上愈加趋于平稳,青年组的大脑结构变化更大,造成了更高的平均大脑PAD.
根据受教育年限将MDD组数据集分为小学及以下、初中、高中、大专及以上,结果表明受教育程度越高,平均大脑PAD越小(小学及以下+5.23年、初中+4.95年、高中+4.52年、大专及以上+4.03年),这表明学习经验在一定程度上能够增加大脑结构的稳定性,当遭遇MDD这类神经退性疾病的时候,大脑结构受到影响相对会更小.
以上实验结果通过箱线图的形式在图7中展示,分别为健康组与MDD组的对比,MDD组内青少年、中年与老年不同年龄段的对比,MDD组内男性、女性不同性别的对比,MDD组内小学、初中、高中、大专以上不同受教育程度的对比.
图7
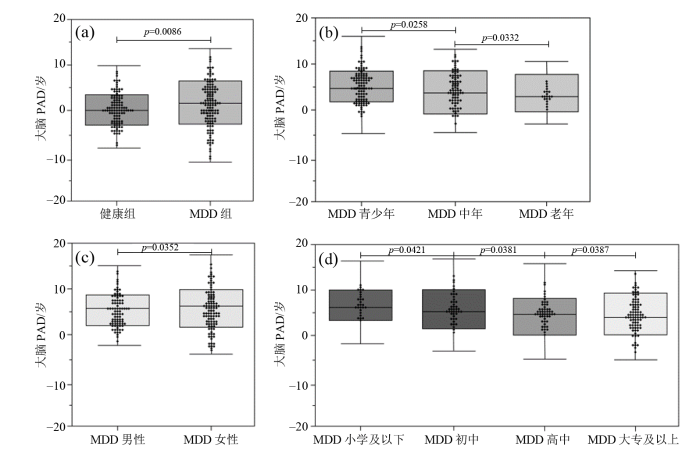
图7
不同临床特征对MDD患者的影响.(a)病患差异;(b)不同年龄组差异;(c)不同性别组差异;(d)不同受教育程度组差异
Fig. 7
The influence of different clinical features on MDD patients. (a) Differences in disease; (b) Differences in age groups; (c) Differences in gender groups; (d) Differences in education groups
3.3 讨论
表5 同类研究结果对比
Table 5
本方法仍有一定的局限性. 首先,训练数据中各年龄段的分布并不均匀,部分年龄段样本量少的客观情况不可避免地会对整体年龄段模型的预测产生一定的影响,这是未来的研究需要解决的问题. 其次,在本次研究只讨论了MDD组和健康组的对比,如果能在数据丰富的情况下,对比相同患者患病前和患病后的差异,可能会更好地阐明MDD患者大脑衰老的事实. 再次,本次研究的参与者来自25个公开可用的数据集,这些数据集使用不同的扫描仪器和扫描参数,这样的差异可能会对预测分析带来一些目前未知的问题. 最后,MRI包含sMRI和fMRI,本实验只研究了sMRI,未来的研究将融合sMRI和fMRI进行实验,深入探索大脑PAD与疾病诊断指标之间的联系.
4 结论
使用3D CNN模型对大脑sMRI进行回归分析,预测MDD患者平均大脑PAD,不仅能够增加MDD诊断的客观性,还能为MDD类神经退性疾病的提前预防提供一定的帮助. 通过构建和优化模型,利用统计学的独立样本t检验方法验证MDD患者和健康对照组的平均大脑PAD差异,得到p<0.05,即存在显著差异. 结果表明MDD患者中,女性患者的平均大脑PAD会更大;对于不同年龄段,青少年组患者的平均大脑PAD会明显更高;对于不同受教育程度,受教育程度越低患者的平均大脑PAD会越高.
利益冲突
无
参考文献
Differential diagnosis of bipolar disorder and major depressive disorder
[J].
Depression, telomeres and mitochondrial DNA: between- and within-person associations from a 10-year longitudinal study
[J].
Depression and cardiovascular disease: Epidemiological evidence on their linking mechanisms
[J].
DOI:S0149-7634(15)30355-9
PMID:27461915
[本文引用: 1]

Depression's burden of disease goes beyond functioning and quality of life and extends to somatic health. Results from longitudinal cohort studies converge in illustrating that major depressive disorder (MDD) subsequently increases the risk of cardiovascular morbidity and mortality with about 80%. The impact of MDD on cardiovascular health may be partly explained by mediating mechanisms such as unhealthy lifestyle (smoking, excessive alcohol use, physical inactivity, unhealthy diet, therapy non-compliance) and unfavorable pathophysiological disturbances (autonomic, HPA-axis, metabolic and immuno-inflammatory dysregulations). A summary of the literature findings as well as relevant results from the large-scale Netherlands Study of Depression and Anxiety (N=2981) are presented. Persons with MDD have significantly worse lifestyles as well as more pathophysiological disturbances as compared to healthy controls. Some of these differences seem to be specific for (typical versus 'atypical', or antidepressant treated versus drug-naive) subgroups of MDD patients. Alternative explanations are also present, namely undetected confounding, iatrogenic effects or 'third factors' such as genetics.Copyright © 2016 Elsevier Ltd. All rights reserved.
The excess costs of depression: A systematic review and meta-analysis
[J].
Brain aging in major depressive disorder: Results from the enigma major depressive disorder working group
[J].
Hallmarks of aging: An expanding universe
[J].
Epigenetic predictor of age
[J].
Brain-age in midlife is associated with accelerated biological aging and cognitive decline in a longitudinal birth cohort
[J].
Aging biomarker consortium. Biomarkers of aging
[J].
Brain structure, cognition, and brain age in schizophrenia, bipolar disorder, and healthy controls
[J].
DOI:10.1038/s41386-018-0298-z
PMID:30635616
[本文引用: 1]
Schizophrenia and bipolar disorder (BD) may be disorders of accelerated aging. Direct comparison of healthy aging populations with schizophrenia and BD patients across the adult lifespan may help inform this theory. In total, 225 individuals (91 healthy controls, 81 schizophrenia, 53 euthymic BD) underwent 3T T1-weighted magnetic resonance imaging, diffusion tensor imaging, and cognitive testing. We analyzed associations among age, diagnosis, and cognition with cortical thickness and fractional anisotropy (FA) using general linear models. We then assessed "brain age" using a random forest algorithm, which was also assessed in an independent sample (n = 147). Participants with schizophrenia had lower cortical thickness and FA compared with the other two groups, most prominently in fronto-temporal circuitry. These brain changes were more evident in younger participants than in older ones, yet were associated with cognitive performance independent of diagnosis. Predicted age was 8 years greater than chronological age in individuals with schizophrenia in the first sample and 6 years greater in the second sample. Predicted and chronological age were not different in BD. Differences in brain circuitry are present from illness onset most prominently in schizophrenia and to a lesser extent in BD. These results support a non-progressive "early hit" hypothesis/etiology of illness in the major psychoses. Brain age differences support the hypothesized early aging mechanism in schizophrenia but not in BD.
Accelerated functional brain aging in pre-clinical familial Alzheimer’s disease
[J].
Neuroimaging-based brain-age prediction in diverse forms of epilepsy: A signature of psychosis and beyond
[J].
Subcortical shape alterations in major depressive disorder: Findings from the enigma major depressive disorder working group
[J].
Predicting brain age with deep learning from raw imaging data results in a reliable and heritable biomarker
[J].
DOI:S1053-8119(17)30640-7
PMID:28765056
[本文引用: 1]
Machine learning analysis of neuroimaging data can accurately predict chronological age in healthy people. Deviations from healthy brain ageing have been associated with cognitive impairment and disease. Here we sought to further establish the credentials of 'brain-predicted age' as a biomarker of individual differences in the brain ageing process, using a predictive modelling approach based on deep learning, and specifically convolutional neural networks (CNN), and applied to both pre-processed and raw T1-weighted MRI data. Firstly, we aimed to demonstrate the accuracy of CNN brain-predicted age using a large dataset of healthy adults (N = 2001). Next, we sought to establish the heritability of brain-predicted age using a sample of monozygotic and dizygotic female twins (N = 62). Thirdly, we examined the test-retest and multi-centre reliability of brain-predicted age using two samples (within-scanner N = 20; between-scanner N = 11). CNN brain-predicted ages were generated and compared to a Gaussian Process Regression (GPR) approach, on all datasets. Input data were grey matter (GM) or white matter (WM) volumetric maps generated by Statistical Parametric Mapping (SPM) or raw data. CNN accurately predicted chronological age using GM (correlation between brain-predicted age and chronological age r = 0.96, mean absolute error [MAE] = 4.16 years) and raw (r = 0.94, MAE = 4.65 years) data. This was comparable to GPR brain-predicted age using GM data (r = 0.95, MAE = 4.66 years). Brain-predicted age was a heritable phenotype for all models and input data (h ≥ 0.5). Brain-predicted age showed high test-retest reliability (intraclass correlation coefficient [ICC] = 0.90-0.99). Multi-centre reliability was more variable within high ICCs for GM (0.83-0.96) and poor-moderate levels for WM and raw data (0.51-0.77). Brain-predicted age represents an accurate, highly reliable and genetically-influenced phenotype, that has potential to be used as a biomarker of brain ageing. Moreover, age predictions can be accurately generated on raw T1-MRI data, substantially reducing computation time for novel data, bringing the process closer to giving real-time information on brain health in clinical settings.Copyright © 2017. Published by Elsevier Inc.
Relationship between grey matter integrity and executive abilities in aging
[J].
DOI:S0006-8993(16)30265-7
PMID:27107940
[本文引用: 1]
This cross-sectional study was designed to investigate grey matter changes that occur in healthy aging and the relationship between grey matter characteristics and executive functioning. Thirty-six young adults (18-30 years old) and 43 seniors (60-75 years old) were included. A general executive score was derived from a large battery of neuropsychological tests assessing three major aspects of executive functioning (inhibition, updating and shifting). Age-related grey matter changes were investigated by comparing young and older adults using voxel-based morphometry and voxel-based cortical thickness methods. A widespread difference in grey matter volume was found across many brain regions, whereas cortical thinning was mainly restricted to central areas. Multivariate analyses showed age-related changes in relatively similar brain regions to the respective univariate analyses but appeared more limited. Finally, in the older adult sample, a significant relationship between global executive performance and decreased grey matter volume in anterior (i.e. frontal, insular and cingulate cortex) but also some posterior brain areas (i.e. temporal and parietal cortices) as well as subcortical structures was observed. Results of this study highlight the distribution of age-related effects on grey matter volume and show that cortical atrophy does not appear primarily in "frontal" brain regions. From a cognitive viewpoint, age-related executive functioning seems to be related to grey matter volume but not to cortical thickness. Therefore, our results also highlight the influence of methodological aspects (from preprocessing to statistical analysis) on the pattern of results, which could explain the lack of consensus in literature.Copyright © 2016 Elsevier B.V. All rights reserved.
The stage-specifically accelerated brain aging in never-treated first-episode patients with depression
[J].
DOI:10.1002/hbm.25460
PMID:33932251
[本文引用: 1]
Depression associated with structural brain abnormalities is hypothesized to be related with accelerated brain aging. However, there is far from a unified conclusion because of clinical variations such as medication status, cumulative illness burden. To explore whether brain age is accelerated in never-treated first-episode patients with depression and its association with clinical characteristics, we constructed a prediction model where gray matter volumes measured by voxel-based morphometry derived from T1-weighted MRI scans were treated as features. The prediction model was first validated using healthy controls (HCs) in two Chinese Han datasets (Dataset 1, N = 130 for HCs and N = 195 for patients with depression; Dataset 2, N = 270 for HCs) separately or jointly, then the trained prediction model using HCs (N = 400) was applied to never-treated first-episode patients with depression (N = 195). The brain-predicted age difference (brain-PAD) scores defined as the difference between predicted brain age and chronological age, were calculated for all participants and compared between patients with age-, gender-, educational level-matched HCs in Dataset 1. Overall, patients presented higher brain-PAD scores suggesting patients with depression having an "older" brain than expected. More specially, this difference occurred at illness onset (illness duration <3 months) and following 2 years then disappeared as the illness further advanced (>2 years) in patients. This phenomenon was verified by another data-driven method and significant correlation between brain-PAD scores and illness duration in patients. Our results reveal that accelerated brain aging occurs at illness onset and suggest it is a stage-dependent phenomenon in depression.© 2021 The Authors. Human Brain Mapping published by Wiley Periodicals LLC.
Accelerated brain aging in major depressive disorder and antidepressant treatment response: A can-bind report
[J].
Machine-learning based brain age estimation in major depression showing no evidence of accelerated aging
[J].
Cross-sectional and longitudinal MRI brain scans reveal accelerated brain aging in multiple sclerosis
[J].
DOI:10.3389/fneur.2019.00450
PMID:31114541
[本文引用: 1]
Multiple sclerosis (MS) is an inflammatory disorder of the central nervous system. By combining longitudinal MRI-based brain morphometry and brain age estimation using machine learning, we tested the hypothesis that MS patients have higher brain age relative to chronological age than healthy controls (HC) and that longitudinal rate of brain aging in MS patients is associated with clinical course and severity. Seventy-six MS patients [71% females, mean age 34.8 years (range 21-49) at inclusion] were examined with brain MRI at three time points with a mean total follow up period of 4.4 years (±0.4 years). We used additional cross-sectional MRI data from 235 HC for case-control comparison. We applied a machine learning model trained on an independent set of 3,208 HC to estimate individual brain age and to calculate the difference between estimated and chronological age, termed brain age gap (BAG). We also assessed the longitudinal change rate in BAG in individuals with MS. MS patients showed significantly higher BAG (4.4 ± 6.6 years) compared to HC (Cohen's D = 0.69, = 4.0 × 10). Longitudinal estimates of BAG in MS patients showed high reliability and suggested an accelerated rate of brain aging corresponding to an annual increase of 0.41 (SE = 0.15) years compared to chronological aging ( = 0.008). Multiple regression analyses revealed higher rate of brain aging in patients with more brain atrophy (Cohen's D = 0.86, = 4.3 × 10) and increased white matter lesion load (WMLL) (Cohen's D = 0.55, = 0.015). On average, patients with MS had significantly higher BAG compared to HC. Progressive brain aging in patients with MS was related to brain atrophy and increased WMLL. No significant clinical associations were found in our sample, future studies are warranted on this matter. Brain age estimation is a promising method for evaluation of subtle brain changes in MS, which is important for predicting clinical outcome and guide choice of intervention.
Ten years of brainage as a neuroimaging biomarker of brain aging: What insights have we gained
[J].
Biological brain age prediction using cortical thickness data: A large scale cohort study
[J].
DOI:10.3389/fnagi.2018.00252
PMID:30186151
[本文引用: 1]
Brain age estimation from anatomical features has been attracting more attention in recent years. This interest in brain age estimation is motivated by the importance of biological age prediction in health informatics, with an application to early prediction of neurocognitive disorders. It is well-known that normal brain aging follows a specific pattern, which enables researchers and practitioners to predict the age of a human's brain from its degeneration. In this paper, we model brain age predicted by cortical thickness data gathered from large cohort brain images. We collected 2,911 cognitively normal subjects (age 45-91 years) at a single medical center and acquired their brain magnetic resonance (MR) images. All images were acquired using the same scanner with the same protocol. We propose to first apply Sparse Group Lasso (SGL) for feature selection by utilizing the brain's anatomical grouping. Once the features are selected, a non-parametric non-linear regression using the Gaussian Process Regression (GPR) algorithmis applied to fit the final age predictionmodel. Experimental results demonstrate that the proposed method achieves the mean absolute error of 4.05 years, which is comparable with or superior to several recent methods. Our method can also be a critical tool for clinicians to differentiate patients with neurodegenerative brain disease by extracting a cortical thinning pattern associated with normal aging.
Estimating the age of healthy subjects from T1-weighted MRI scans using kernel methods: Exploring the influence of various parameters
[J].
DOI:10.1016/j.neuroimage.2010.01.005
PMID:20070949
[本文引用: 2]
The early identification of brain anatomy deviating from the normal pattern of growth and atrophy, such as in Alzheimer's disease (AD), has the potential to improve clinical outcomes through early intervention. Recently, Davatzikos et al. (2009) supported the hypothesis that pathologic atrophy in AD is an accelerated aging process, implying accelerated brain atrophy. In order to recognize faster brain atrophy, a model of healthy brain aging is needed first. Here, we introduce a framework for automatically and efficiently estimating the age of healthy subjects from their T(1)-weighted MRI scans using a kernel method for regression. This method was tested on over 650 healthy subjects, aged 19-86 years, and collected from four different scanners. Furthermore, the influence of various parameters on estimation accuracy was analyzed. Our age estimation framework included automatic preprocessing of the T(1)-weighted images, dimension reduction via principal component analysis, training of a relevance vector machine (RVM; Tipping, 2000) for regression, and finally estimating the age of the subjects from the test samples. The framework proved to be a reliable, scanner-independent, and efficient method for age estimation in healthy subjects, yielding a correlation of r=0.92 between the estimated and the real age in the test samples and a mean absolute error of 5 years. The results indicated favorable performance of the RVM and identified the number of training samples as the critical factor for prediction accuracy. Applying the framework to people with mild AD resulted in a mean brain age gap estimate (BrainAGE) score of +10 years.Copyright 2010 Elsevier Inc. All rights reserved.
Brain age predicts mortality
[J].
Deep learning for brain age estimation: A systematic review
[J].
Disrupted intrinsic functional brain topology in patients with major depressive disorder
[J].
Reduced default mode network functional connectivity in patients with recurrent major depressive disorder
[J].
Advances in construction of human brain atlases from magnetic resonance images
[J].
基于磁共振成像的人脑图谱构建方法研究进展
[J].
DOI:10.11938/cjmr20192706
[本文引用: 1]
基于磁共振成像的脑图谱构建对于脑与认知科学的研究非常重要,借助脑图谱,研究者可以精确地分析比较不同的脑影像数据,然而目前尚没有比较统一的标准脑图谱.本文针对基于磁共振成像的脑图谱构建方法进行概述,首先介绍了人脑图谱构建的发展进程,阐述脑图谱构建中需解决的技术问题及其局限性;然后着重描述了构建脑图谱的基本方法;最后论述了应用脑图谱进行精确定量分析的统计学方法,包括基于体素的形态学测量分析法和基于纤维束示踪的空间统计分析法,并较深入地比较了两种方法的差异和近期研究进展.通过分析目前研究现状,本文总结了脑图谱构建研究中的主要方法及不足,并就该领域未来的研究进展进行了展望.
Predicting brain age using machine learning algorithms: A comprehensive evaluation
[J].
The alteration of rich club in brain functional network in internet gaming disorder
[J].
网络游戏障碍人群大脑功能网络rich club结构的改变
[J].
DOI:10.11938/cjmr20212967
[本文引用: 1]
网络游戏障碍(internet gaming disorder,IGD)极大的影响了青少年的学习与生活.IGD于2013年被纳入《精神障碍诊断与统计手册》第5版(DSM-5),但其神经机制还不清楚.本研究通过静息态功能磁共振成像研究30例IGD被试以及年龄、性别与之匹配的30例健康对照,分析他们大脑功能网络的rich club结构的差异.结果表明,IGD组和对照组均存在rich club结构,rich club脑区主要包含默认模式、执行控制、突显、感觉运动、听觉与视觉网络中的脑区;同时IGD组的rich club连接增加;此外,IGD组的右侧眶部额下回的度显著高于健康对照组. 这些发现表明了IGD人群大脑功能网络的rich club结构发生了改变.
Accelerated brain aging in schizophrenia and beyond: A neuroanatomical marker of psychiatric disorders
[J].
DOI:10.1093/schbul/sbt142
PMID:24126515
[本文引用: 3]
Structural brain abnormalities are central to schizophrenia (SZ), but it remains unknown whether they are linked to dysmaturational processes crossing diagnostic boundaries, aggravating across disease stages, and driving the neurodiagnostic signature of the illness. Therefore, we investigated whether patients with SZ (N = 141), major depression (MD; N = 104), borderline personality disorder (BPD; N = 57), and individuals in at-risk mental states for psychosis (ARMS; N = 89) deviated from the trajectory of normal brain maturation. This deviation was measured as difference between chronological and the neuroanatomical age (brain age gap estimation [BrainAGE]). Neuroanatomical age was determined by a machine learning system trained to individually estimate age from the structural magnetic resonance imagings of 800 healthy controls. Group-level analyses showed that BrainAGE was highest in SZ (+5.5 y) group, followed by MD (+4.0), BPD (+3.1), and the ARMS (+1.7) groups. Earlier disease onset in MD and BPD groups correlated with more pronounced BrainAGE, reaching effect sizes of the SZ group. Second, BrainAGE increased across at-risk, recent onset, and recurrent states of SZ. Finally, BrainAGE predicted both patient status as well as negative and disorganized symptoms. These findings suggest that an individually quantifiable "accelerated aging" effect may particularly impact on the neuroanatomical signature of SZ but may extend also to other mental disorders. © The Author 2013. Published by Oxford University Press on behalf of the Maryland Psychiatric Research Center. All rights reserved. For permissions, please email: journals.permissions@oup.com.
Brain aging in major depressive disorder: Results from the enigma major depressive disorder working group
[J].
Accelerated brain aging predicts impulsivity and symptom severity in depression
[J].
DOI:10.1038/s41386-021-00967-x
PMID:33495545
[本文引用: 2]
Multiple structural and functional neuroimaging measures vary over the course of the lifespan and can be used to predict chronological age. Accelerated brain aging, as quantified by deviations in the MRI-based predicted age with respect to chronological age, is associated with risk for neurodegenerative conditions, bipolar disorder, and mortality. Whether age-related changes in resting-state functional connectivity are accelerated in major depressive disorder (MDD) is unknown, and, if so, it is unclear if these changes contribute to specific cognitive weaknesses that often occur in MDD. Here, we delineated age-related functional connectivity changes in a large sample of normal control subjects and tested whether brain aging is accelerated in MDD. Furthermore, we tested whether accelerated brain aging predicts individual differences in cognitive function. We trained a support vector regression model predicting age using resting-state functional connectivity in 710 healthy adults aged 18-89. We applied this model trained on normal aging subjects to a sample of actively depressed MDD participants (n = 109). The difference between predicted brain age and chronological age was 2.11 years greater (p = 0.015) in MDD patients compared to control participants. An older MDD brain age was significantly associated with increased impulsivity and, in males, increased depressive severity. Unexpectedly, accelerated brain aging was also associated with increased placebo response in a sham-controlled trial of high-frequency repetitive transcranial magnetic stimulation targeting the dorsomedial prefrontal cortex. Our results indicate that MDD is associated with accelerated brain aging, and that accelerated aging is selectively associated with greater impulsivity and depression severity.
Ethnic identity and major depression in asian American subgroups nationwide: Differential findings in relation to subcultural contexts
[J].
DOI:10.1002/jclp.22214
PMID:26335455
[本文引用: 1]
Asian Americans (AA) are the fastest growing minority population in the United States. Leading AA scholars have highlighted the unmet service needs and the necessity to investigate subgroup variations in the mental health of AAs. This study addressed a research gap of whether racial and ethnic identity (REI) in three AA subgroups (Chinese, Filipino, and Vietnamese) consistently protects against major depressive disorder (MDD), counteracting the deleterious role of discrimination.Using the National Latino and Asian American Study (NLAAS), we explored the varying and incremental predictive values of REI, above and beyond the effects of known demographic and acculturation predictors, alongside other potentially protective factors.In three sets of two-step logistic regressions, REI had an inverse relationship with MDD in the Filipino subgroup only but a positive association in the Chinese subgroup. The damaging role of negative REI moderated the effect of discrimination. The longest stay in the United States and discrimination predicted a higher likelihood of a MDD diagnosis in the Filipino subgroup. Social support contributed to the lower odds of MDD in Chinese and Vietnamese subgroups, had lower odds of having MDD, and religious attendance may act as a protective factor in the Vietnamese subgroup.Our findings do not reinforce uniform protection of REI but lend partial support for two underlying rationales. Based on cultural psychologists' framework, inconsistent findings are interpreted within the sociocultural contexts of the 3 subgroups.© 2015 Wiley Periodicals, Inc.
