基于级联网络的膝关节图像分割与模型构建
Knee Joint Image Segmentation and Model Construction Based on Cascaded Network

基于级联网络的膝关节图像分割与模型构建 |
| 马岩,邢藏菊,肖亮 |
|
Knee Joint Image Segmentation and Model Construction Based on Cascaded Network |
| Yan MA,Cang-ju XING,Liang XIAO |
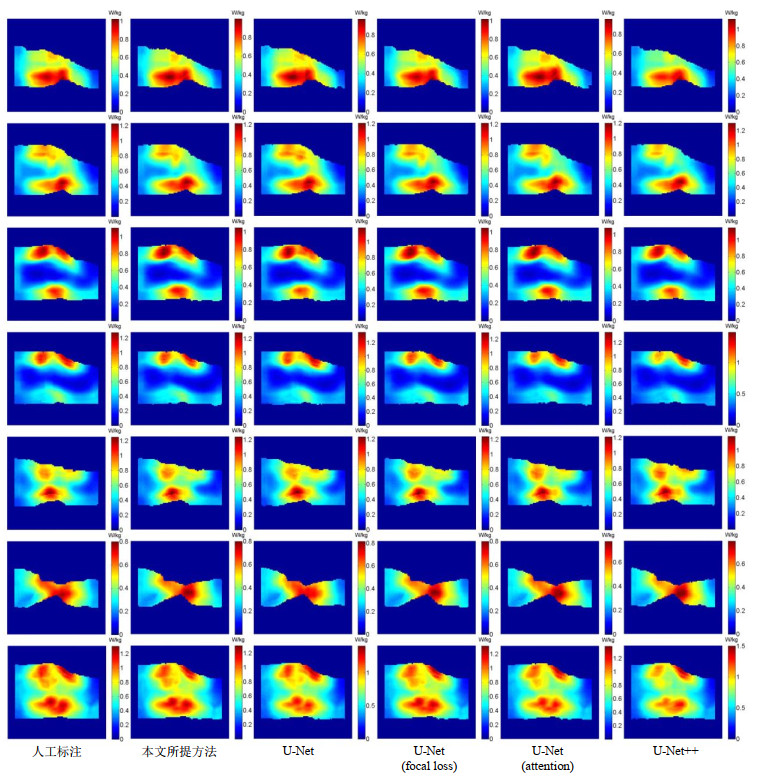
| 图5 一位志愿者的膝关节SAR10g分布图.从左到右,分别基于人工标注结果,使用本文所提方法、采用交叉熵损失的U-Net,采用焦点损失的U-Net、采用attention机制的U-Net以及U-Net++得到的模型,6种方法的SAR10g值分别为1.309 8 W/kg、1.304 5 W/kg、1.402 4 W/kg、1.316 2 W/kg、1.383 5 W/kg、1.506 0 W/kg.第1行到第6行为6个均匀分布的切片的SAR10g分布图,最后1行为SAR10g的最大密度投影 |
| Fig.5 SAR10g distribution maps of a volunteer's knee joint. From left to right, they are based on the manual segmentation, and the models obtained by the proposed method, the U-Net using cross-entropy loss, the U-Net using focus loss, the U-Net using attention mechanism and U-Net++, respectively. The SAR10g values of the six models are 1.309 8 W/kg, 1.304 5 W/kg, 1.402 4 W/kg, 1.316 2 W/kg, 1.383 5 W/kg, 1.506 0 W/kg. The first row to the sixth row are the SAR10g distribution maps of 6 uniformly distributed slices, and the last row is the maximum density projection of the SAR10g |

|