基于同伦l0范数最小化重建的三维动态磁共振成像
3D Dynamic MRI with Homotopic l0 Minimization Reconstruction
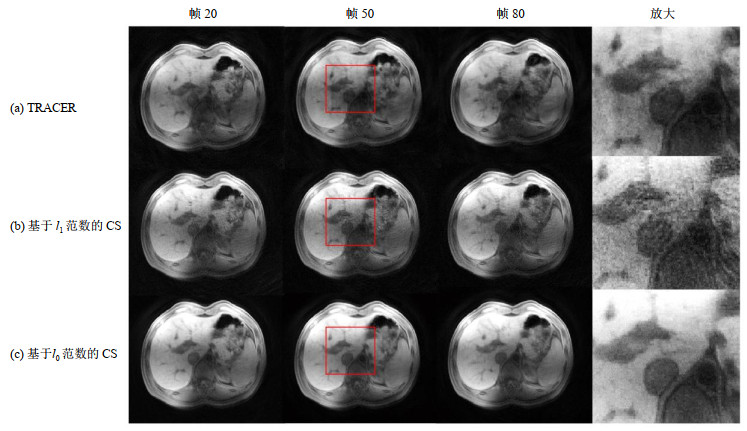
图7. 非对比增强肝脏图像重建结果(欠采样率为24).前三列显示帧20、帧50和帧80,第四列显示帧50中红色框里被放大的区域,图(a)~(c)分别显示了使用TRACER、基于l1最小化的CS和基于l0最小化的CS重建图像
Fig.7. Reconstruction results of the non-contrast-enhanced liver image series (undersampling rate = 24). The first three columns show frame 20, frame 50, frame 80 and the fourth column shows the regions in the red boxes in frame 50 which are zoomed in. Rows (a), (b), (c) show the reconstruction results using TRACER, CS with l1 minimization and l0 minimization respectively

