基于同伦l0范数最小化重建的三维动态磁共振成像
3D Dynamic MRI with Homotopic l0 Minimization Reconstruction
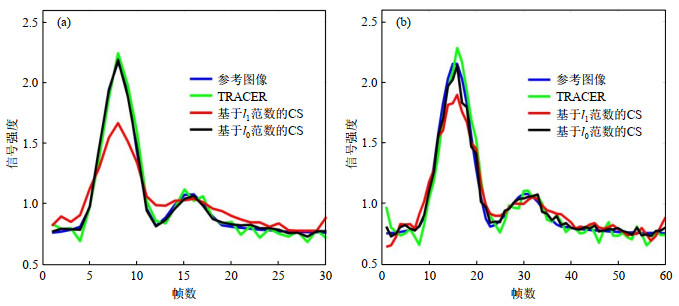
图5. 小圆盘中的模拟信号强度曲线.这些图显示了在固定欠采样率(时间分辨率)下不同算法的性能,(a)和(b)分别显示了12倍欠采样率和24倍欠采样率的结果,蓝色曲线是信号强度曲线的参考,绿色,红色和黑色曲线分别代表TRACER,基于l1最小化的CS和基于l0最小化的CS方法得到的信号强度曲线
Fig.5. The simulated signal intensity curves in the small discs. These figures show the performance of different algorithms in a fixed undersampling rate (temporal resolution). (a) and (b) show the results with 12-fold undersampling rate and 24-fold undersampling rate respectively. The blue curve represents the reference of the signal intensity curve. The green, red, black curves represent the signal intensity curves resulting from TRACER, CS with l1 minimization and l0 minimization respectively

