基于同伦l0范数最小化重建的三维动态磁共振成像
3D Dynamic MRI with Homotopic l0 Minimization Reconstruction
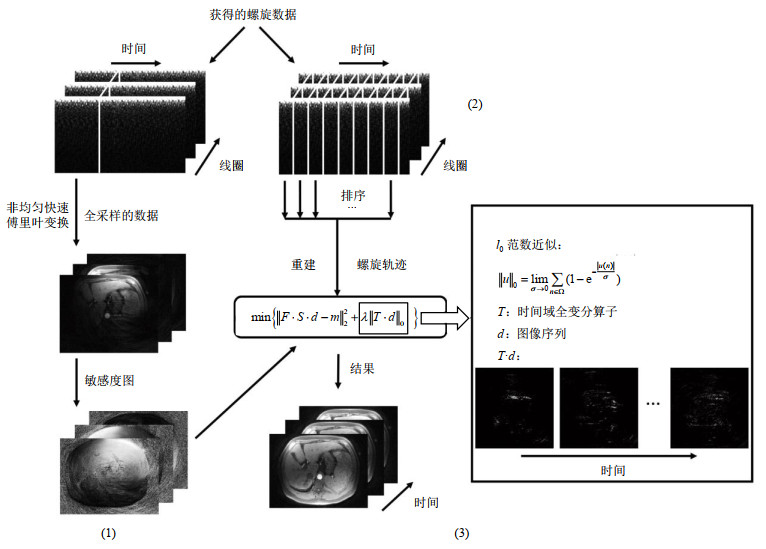
图2. 基于l0最小化方法的图像重建过程.(1)中,从随时间推移的全采样螺旋数据中得到敏感度图;(2)中,将获得的k空间数据排序成一些欠采样的组;(3)中,针对中间的最小化问题,将排序后的数据重建为动态图像序列,在右边黑色框中l0范数的近似被表示成一个极限,并且图中展示出了稀疏变换(时间全变分)后的图像序列
Fig.2. The reconstruction process of the proposed method with l0 minimization. In part (1), sensitivity maps are acquired from the full-sampled spiral data through time. In part (2), the acquired k-space data is sorted into several undersampled groups. In part (3), the sorted data is reconstructed to dynamic image series with the minimization problem in the middle. In the right black box, the approximation of l0 norm is expressed with a limitation, and the image series after the sparse transform (temporal total variation) are shown

