固体核磁共振技术研究金属氧化物类固体酸催化剂的酸碱性
Acidity and Basicity of Solid Acid Catalysts Studied by Solid-State NMR
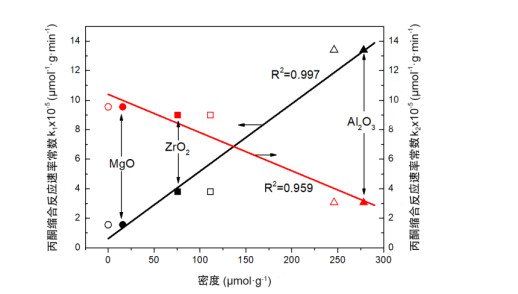
图7. 丙酮缩合反应速率常数k1和k2与催化剂表面酸密度的关系(○、□和△为单吸附表征结果,●、■和▲为共吸附表征结果)(依据文献[
Fig.7. The plot of reaction rate constant (k1 and k2) of acetone condensation against the total acid density. ○, □ and △ represent total acid data determined by sole adsorption method and ●, ■ and ▲ represent total acid data determined by co-adsorption method (Reproduced from Ref. [

